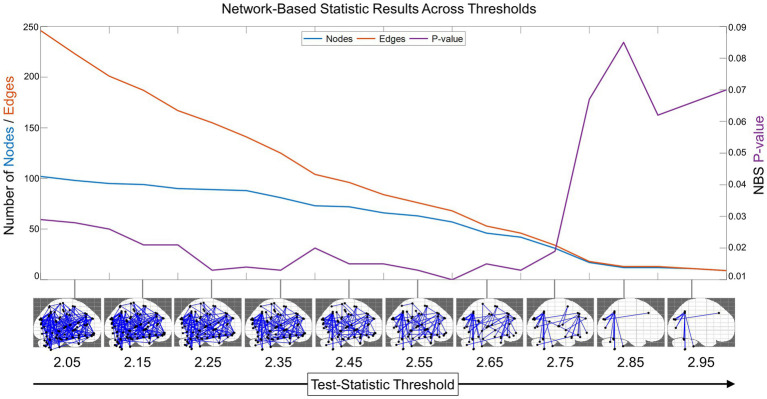
Figure 2.
Network-based statistic (NBS) optimal threshold and sensitivity. To identify the optimal test-statistic threshold for the minimal connected subnetwork that was still significant after multiple comparisons, we computed the NBS results (with 2,000 randomized network permutations) across the interval from 2 to 3 with step size = 0.05 (for visualization purposes, NBS results in the sagittal plane are shown from 2.05 to 2.95). This revealed that the functional connectivity network has a subnetwork related to prosocial and compassionate trait-based measures that was enduring and significant across many test-statistic thresholds. The decreasing number of edges is shown in orange, the number of nodes in blue (scale on left y-axis), and the change in NBS-corrected value of p is shown in purple (scale on right y-axis). This plot reveals the optimal minimal subnetwork threshold to be test-statistic = 2.75.

