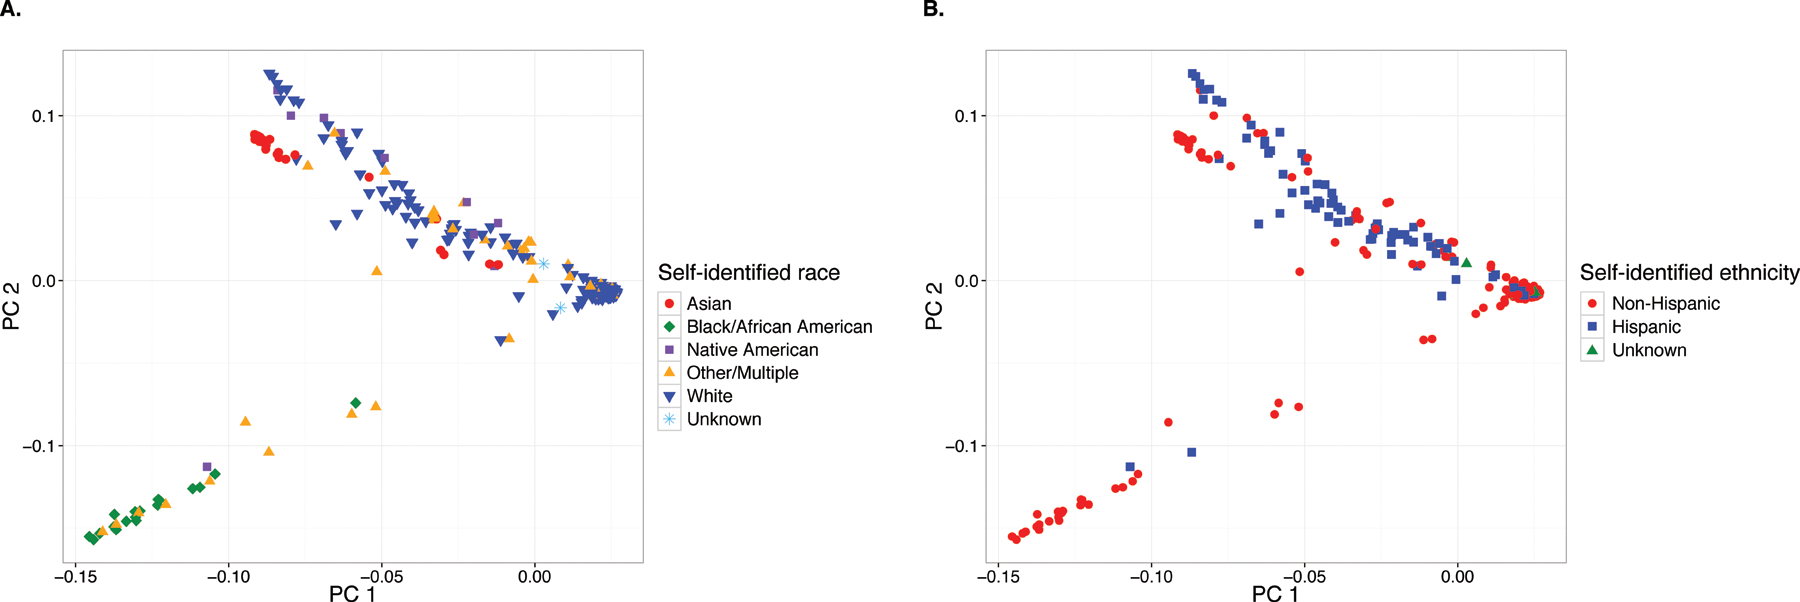
FIGURE 1.

Principal component analysis (PCA) biplots for 538 study subjects based on 289,639 genome-wide markers. (A) Subjects are identified based on self-identified race, illustrating both clustering in accordance with self-identified race as well as considerable genetic substructure, particularly among Whites. (B) Subjects are identified based on self-identified ethnicity, illustrating lack of separation between Hispanics from Non-Hispanics.
