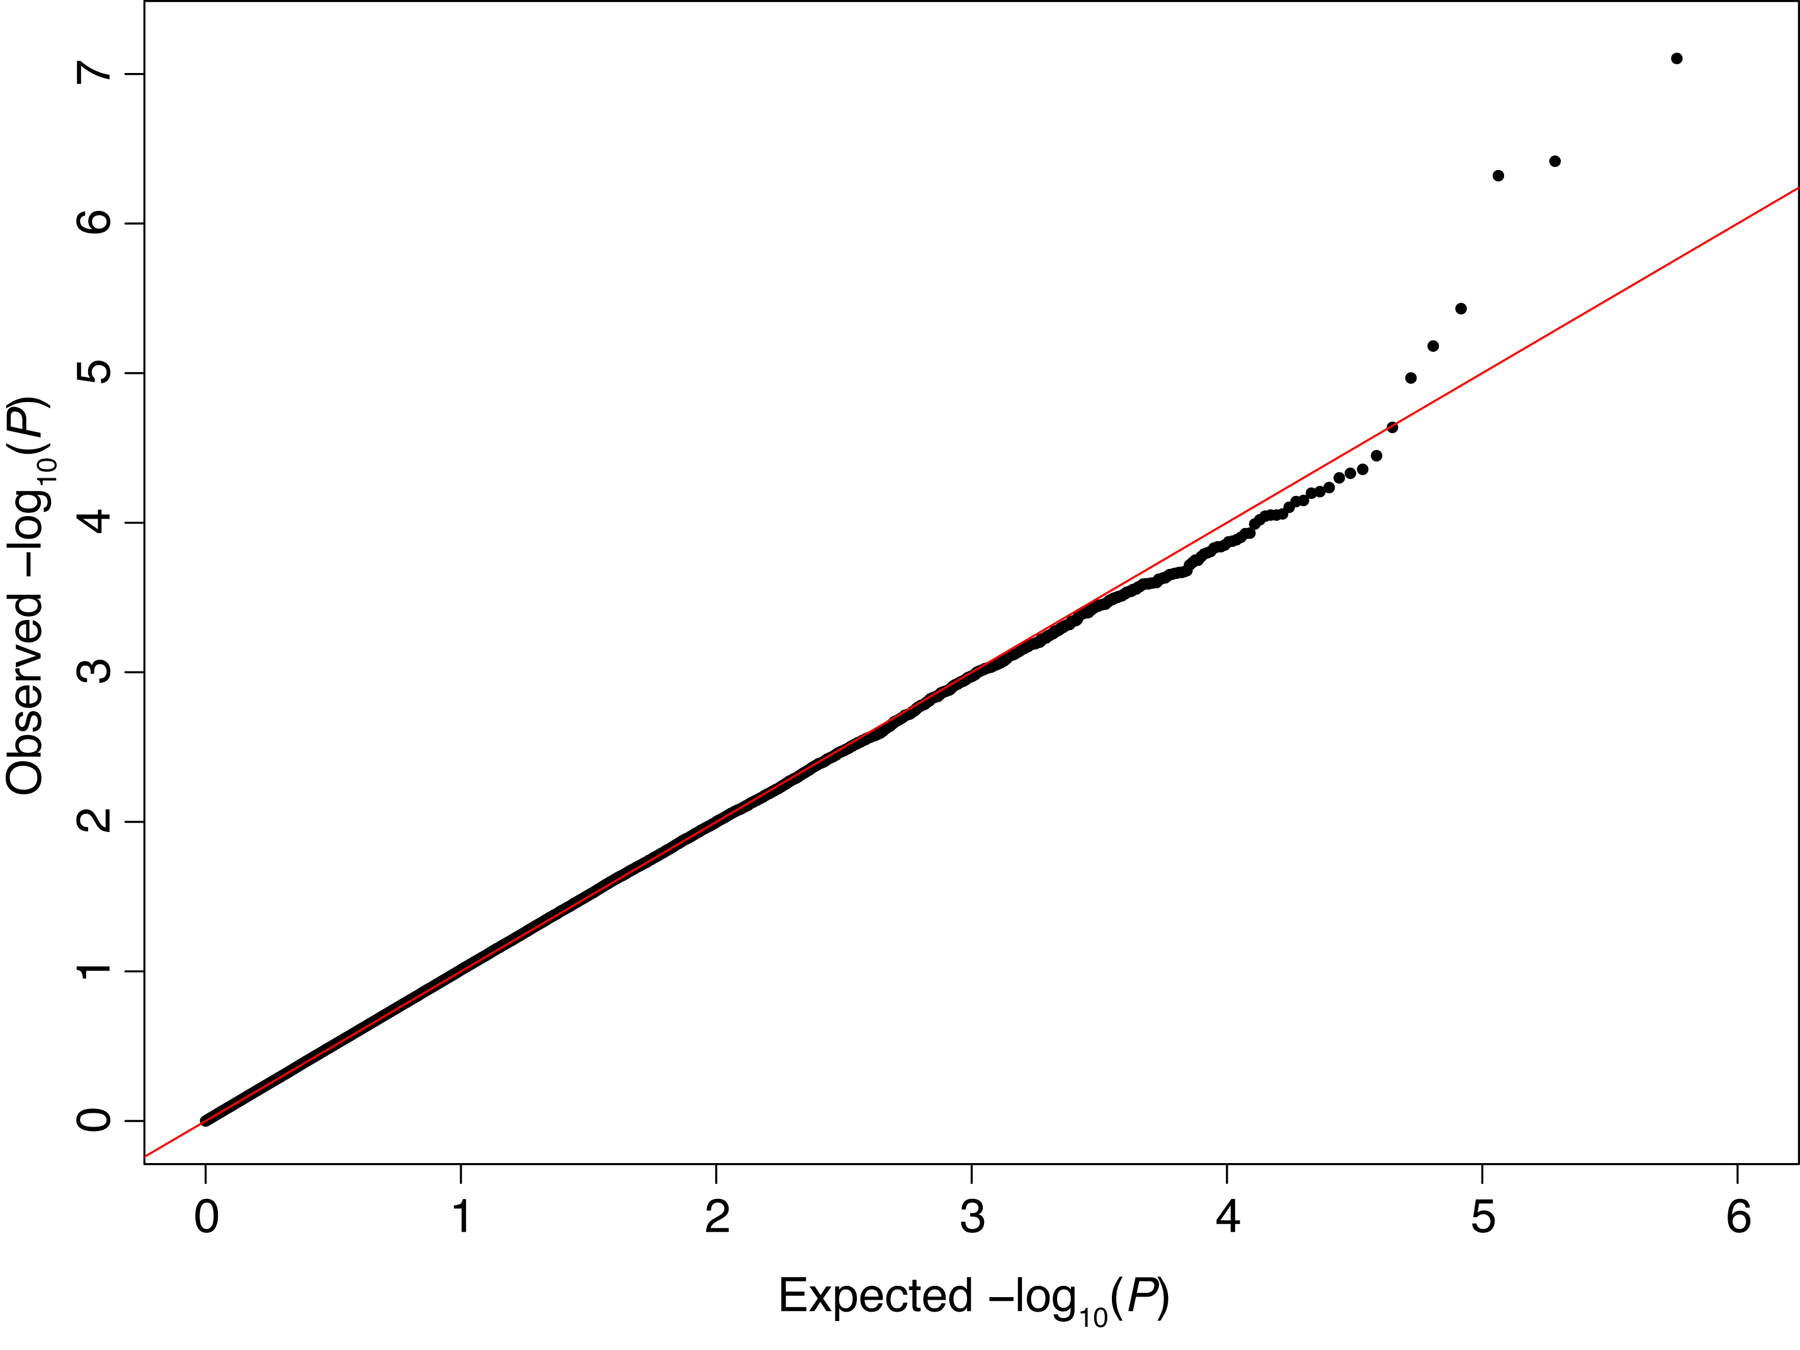
FIGURE 2.

Quantile-quantile (QQ) plot of P values from association testing of genome-wide markers with post-burn scar height. Close correspondence of the observed P-values to the expected null distribution (solid line) indicates adequate correction for population genetic structure.
