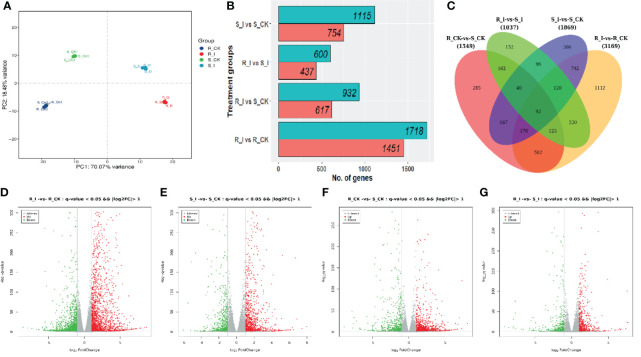
Figure 4.
(A) Principal component analysis (PCA) of the replicated samples used for RNA-sequencing. All samples represented consistency in data among replicates. S/R_CK and S/R_I genotype factors showed variation among mock and diseases inoculated after 48 h. (B) Number of DEGs (p value < 0.005, statistically significant ≥ 2-fold), in different comparisons. (C) Venn graphs represent a cluster of DEGs from resistant and susceptible groups and interaction between the various treatment groups. (D–G) The volcano indicates the DEGs. Each dot in the figure signifies a particular gene. The green dot shows a significantly down-regulated gene, the red dot specifies a significantly up-regulated gene, and the dark grey dot is a group of non-significant differential genes.

