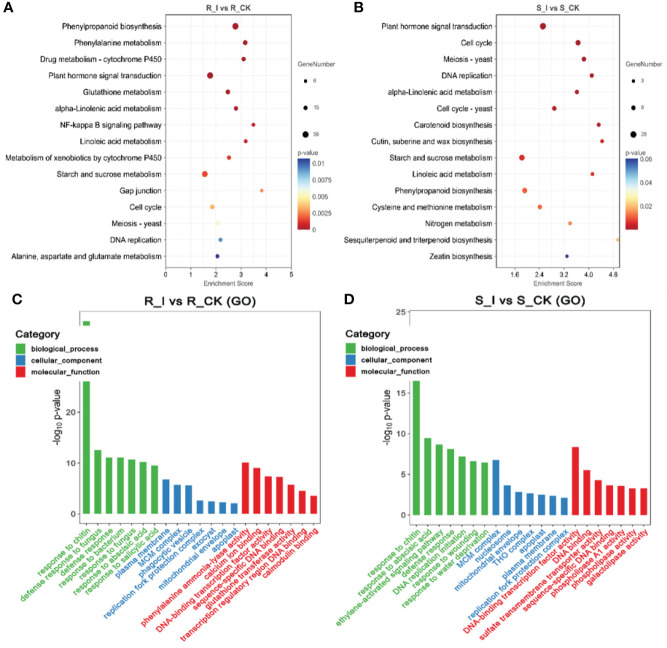
Figure 5.
Pathway functional analysis of DEGs. The X and Y-axis represent enrichment factor and pathway names, respectively. A colored bubble represents p-value, and Rich Factor refers to the value of enrichment factor, which is the quotient of foreground value (the number of DEGs). (A) DEGs that were up-regulated in the R_I vs. R_CK groups. (B) DEGs that were up-regulated in the S_I vs. S_CK groups. (C, D) GO analysis of DEGs classified as biological, cellular, or molecular functions.

