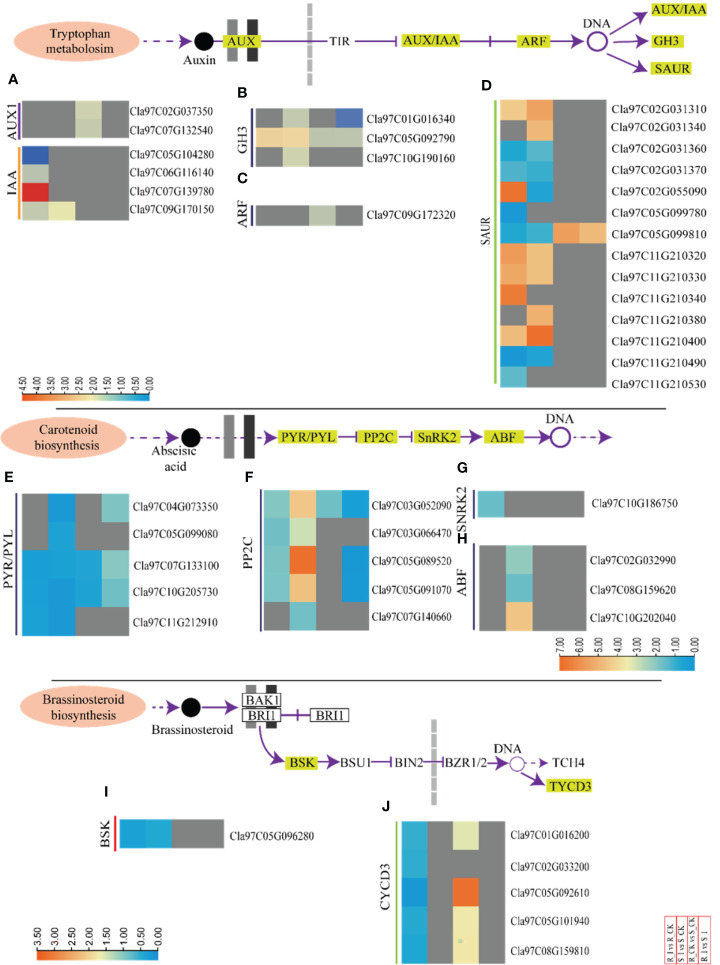
Figure 6.
Transcriptomic analyses of incompatible and compatible interactions of the PM fungus in different watermelon lines. DEGs associated to auxin, abscisic acid and brassinosteriods from various combinations, such as groups R_I vs. R_CK, S_I vs. S_CK, R_CK vs. S_CK, and R_I vs. S_I, are presented in the form of a heatmap. The Log FC values corresponding to each gene in a group are used to generate a heatmap. The red and blue colours specify up-and down-regulated expressions. Genes related to IAA and AUX1 (A), GH3 (B), ARF (C), and SAUR (D), PYR/PYL (E), PP2C (F), SnRK2 (G), ABF (H), BSK and CYCD3 (I, J) are categorically shown in various combination groups. In the same way, heatmaps are used to show the genes of the abscisic acid (E–H) and brassinosteroid (I, J) biosynthesis pathways.

