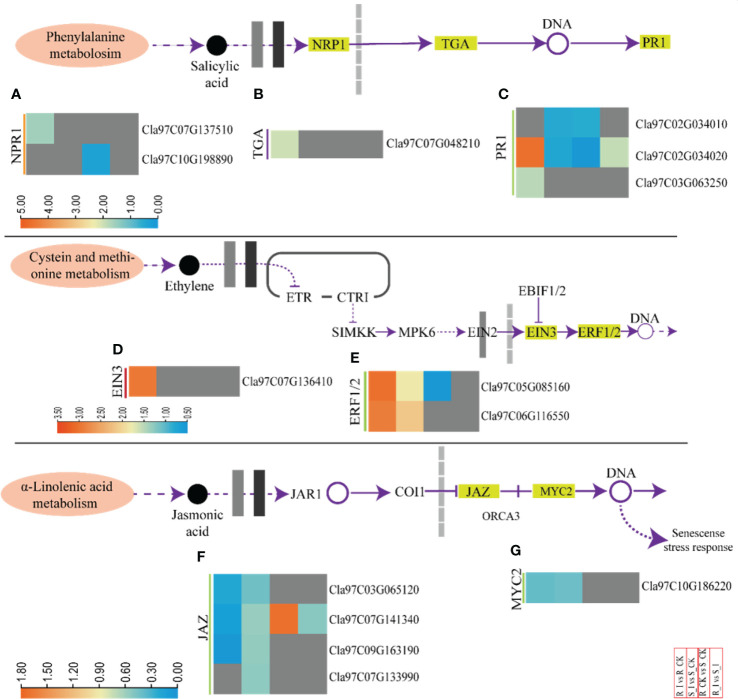
Figure 7.
A heatmap of the genes related to phytohormone defense related activities with differential expression after PM infection in susceptible and resistant watermelon lines, over early stages of invasion in leaves. A heatmap shows DEGs from the NPR1 (A), TGA (B), PR1 (C), EIN3 (D), ERF1/2 (E), JAZ (F), and MYC2 (G) gene families from the different comparison groups R_I vs.. R_CK, S_I vs.. S_CK, R_CK vs.. S_I, and R_I vs.. S_I. The Log FC values corresponding to each gene in a group are used to generate a heatmap. The red and blue colours specify up-and down-regulated expressions.

