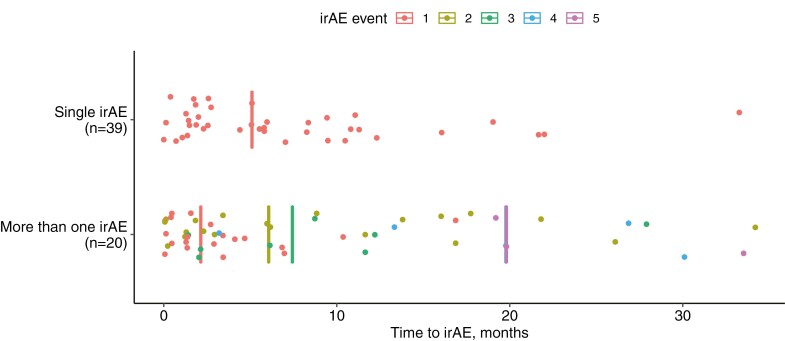
Figure 2.
Time to development of immune-related adverse events (irAEs) in ICI survivors. Time to irAE was compared for patients experience a single irAE (top) and more than one, or multisystem, irAE (bottom). Each dot represents the time to irAE from ICI treatment initiation. Median time to irAE events are depicted as vertical lines. Median time to first irAE event was compared by Wilcoxon rank-sum test between patients in the single and multi-system irAE groups (P = .03). For multisystem irAEs, the median time to fourth (blue) or fifth (pink) irAEs were the same and are overlapping in the figure.

