Figure 3.
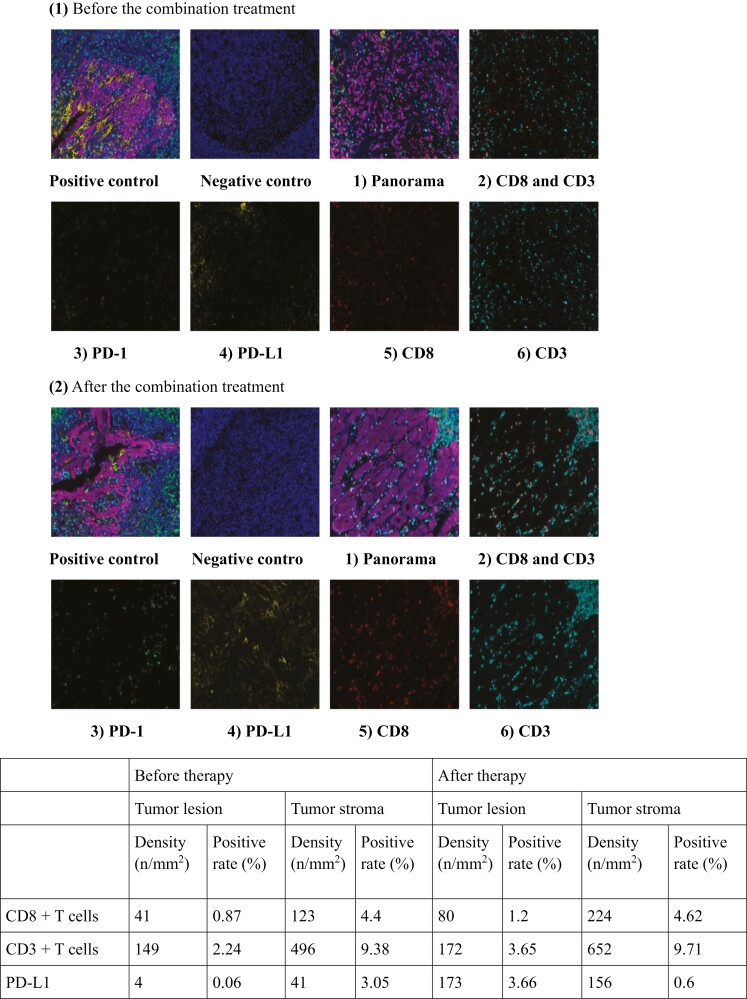
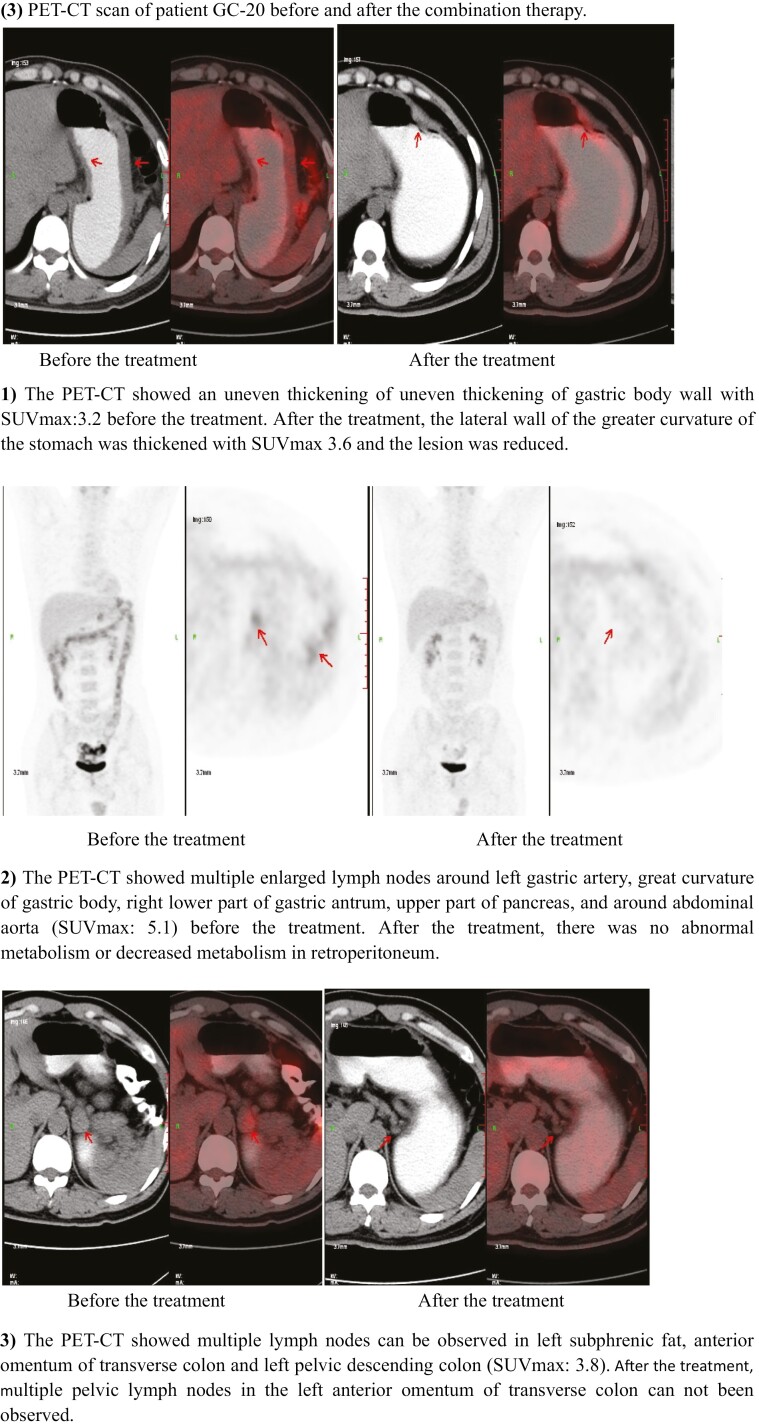
Tumor microenvironment analysis of patient GC-20 who was underwent surgery after 8 courses of combination treatment: (1) The immune microenvironment of the tumor before combination treatment: 1) the immune microenvironment panorama, 2) expression of CD3 and CD8, 3) expression of PD-1, 4) expression of PD-L1, 5) expression of CD8, 6) expression of CD3; (2) The immune microenvironment of the tumor after combination treatment: 1) the immune microenvironment panorama, 2) expression of CD3 and CD8, 3) expression of PD-1, 4) expression of PD-L1, 5) expression of CD8, 6) expression of CD3 (CD8: red; CD3: cyan; PD-L1: yellow; PD-1: green; panCK: purple; DAPI: blue); (3) PET-CT scan of patient GC-20 before and after the combination therapy: 1) the PET-CT showed an uneven thickening of uneven thickening of the gastric body wall with (SUVmax:3.2) before treatment. After treatment, the lateral wall of the greater curvature of the stomach was thickened (SUVmax 3.6), and the lesion was red uced; 2) the PET-CT showed multiple enlarged lymph nodes around left of the gastric artery, great curvature of the gastric body, right lower part of the gastric antrum, upper part of the pancreas, and around the abdominal aorta (SUVmax: 5.1) before the treatment. After the treatment, there was no abnormal metabolism or decreased metabolism in the retroperitoneum; 3) the PET-CT showed multiple lymph nodes could be observed in left subphrenic fat, the anterior omentum of the transverse colon and the left pelvic descending colon (SUVmax: 3.8). After treatment, multiple pelvic lymph nodes in the left anterior omentum of transverse colon could not been observed.


