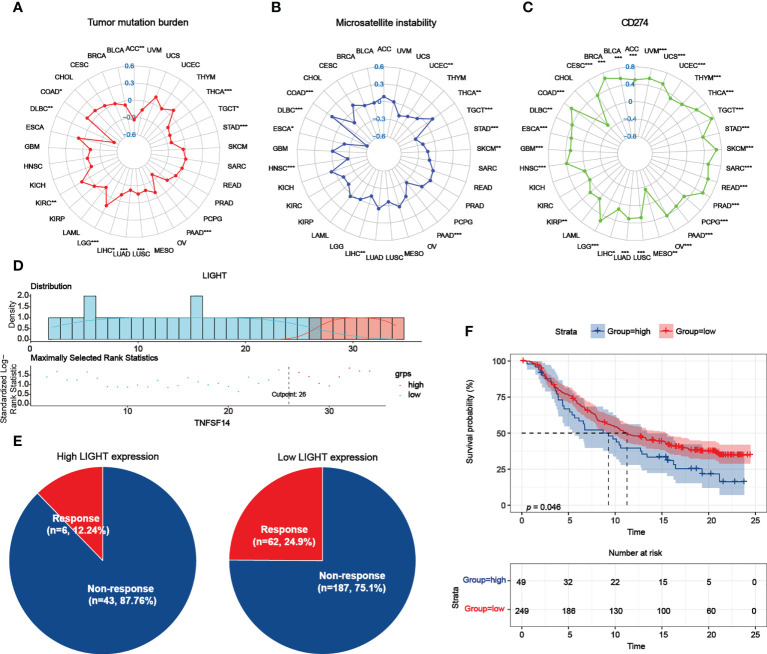
Figure 10.
Role of LIGHT expression in response to ICB therapy. (A–C) The association between LIGHT expression and TMB (A), MSI (B), and CD274 expression levels (C) was shown by radar graphs. The correlation coefficient is shown by the dots in radar charts. (D) The “survminer” package’s optimal cutoff values for the low- or high-LIGHT expression group. (E) The percentage of patients with low or high LIGHT expression that responded to PD-L1 block immunotherapy was depicted in pie plots. (F) The Kaplan-Meier curve in the anti-PD-L1 immunotherapy cohort indicated the survival of the patient groups with high and low LIGHT expression (IMvigor210 dataset; P = 0.046, Log-rank test).

