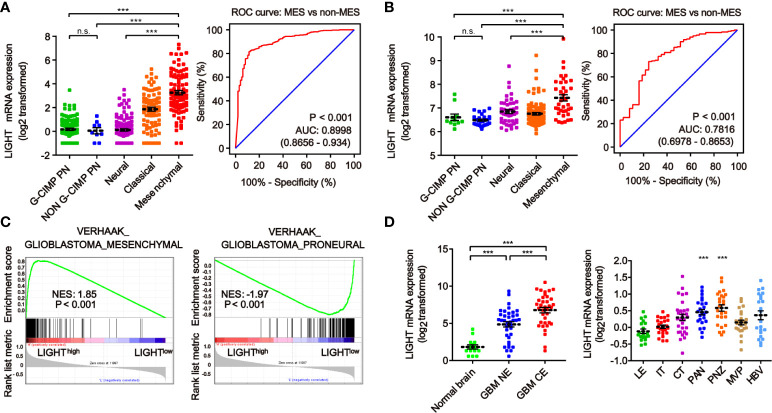
Figure 2.
The heterogeneity of LIGHT expression within and between gliomas. The expression level of LIGHT mRNA in gliomas classified by the VERHAAK_2010 molecular classification, including CpG island methylator phenotype (G-CIMP) proneural, non-G-CIMP proneural, neural, classical, and mesenchymal subtypes, in the TCGA (A) and CGGA (B) databases. The corresponding ROC curves indicated that LIGHT is a diagnostic marker of the mesenchymal subtype. (C) GSEA enrichment of MES and PN signatures analyzing LIGHThigh vs LIGHTlow samples in the TCGA dataset of GBM. The normalized enrichment score (NES) and FDR are noted in the figure. (D) The analysis of LIGHT mRNA levels with the Gill dataset (n = 75) in different radiographical regions of GBM, including normal brain, T1 contrast-enhancing (CE) area and non-enhancing (NE; abnormal T2/FLAIR signal) area. (E) The analysis of LIGHT mRNA levels with IVY GBM RNA-seq data (n = 270) of different anatomical regions, including LE (Leading Edge), IT (Infiltrating Tumor), CT (Cellular Tumor), PAN (Pseudopalisading Cells Around Necrosis), PNZ (Perinecrotic Zone), MVP (Microvascular Proliferation), and HBV (Hyperplastic Blood Vessels). ns P >0.05; ***P < 0.001.

