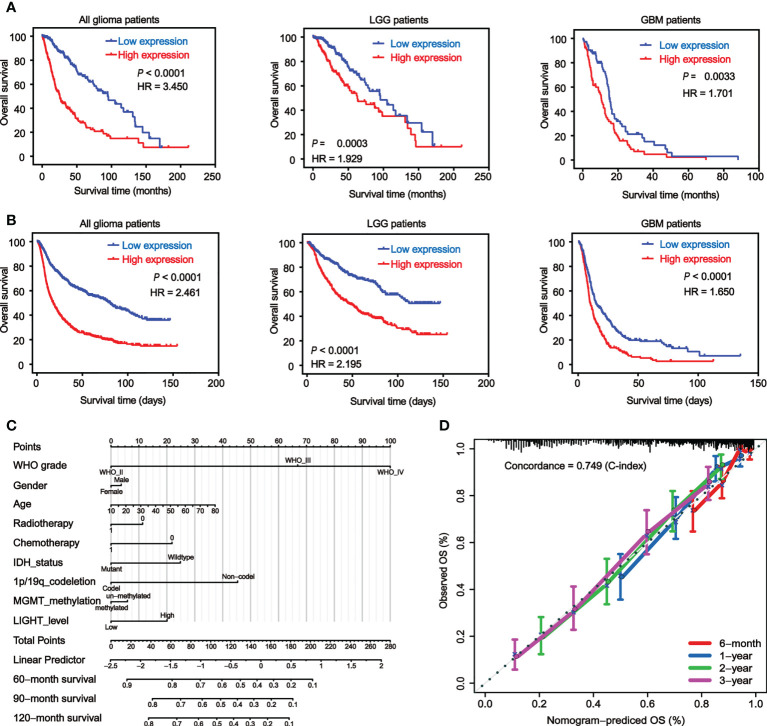
Figure 3.
Elevated LIGHT expression predicts worse prognosis of GBM patients. Kaplan−Meier analysis of the overall survival (OS) rate of all glioma, LGG and GBM patients in the TCGA (A) and CGGA (B) datasets. (C) Nomogram predicting the proportion of glioma patients with OS. (D) Calibration plot showing the predicted and observed OS. The predictive performance of the model is compared to the perfect prediction, which is the diagonal line.

