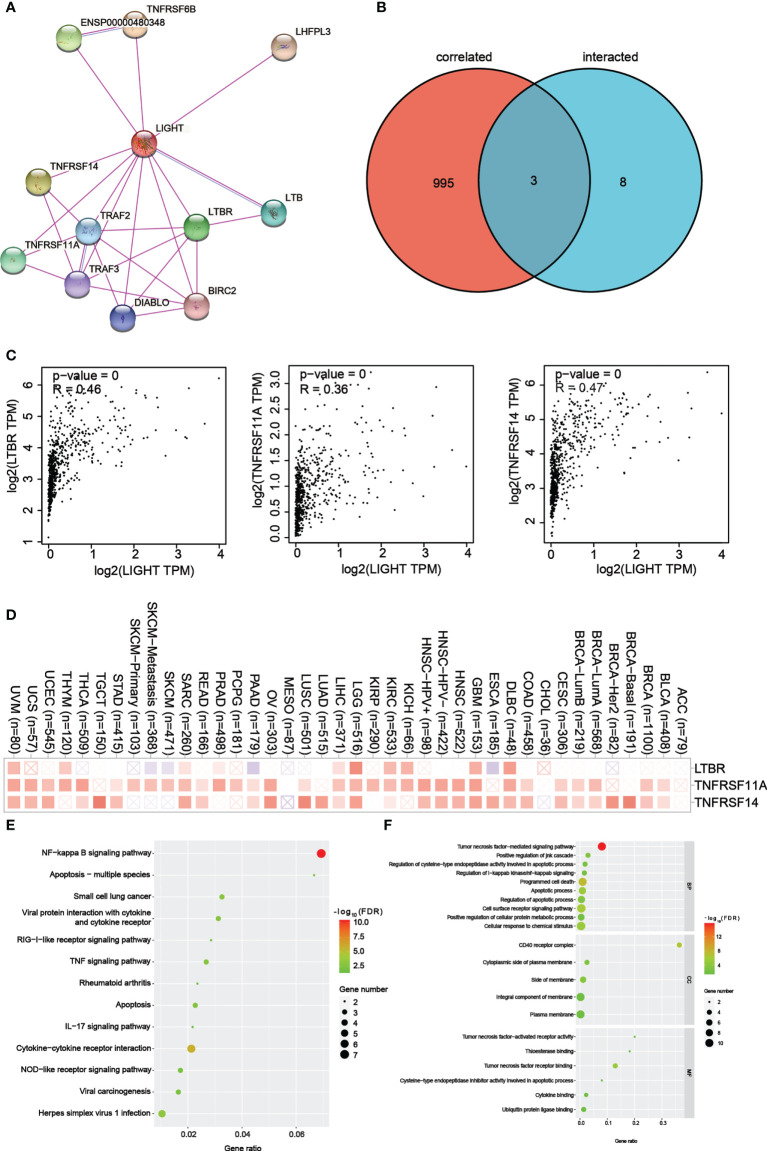
Figure 8.
LIGHT-related gene enrichment analysis. (A) We first obtained the available experimentally determined LIGHT-binding proteins using the STRING tool. (B) An intersection analysis of LIGHT binding (from STRING) and correlated genes (from GEPIA2) was conducted. (C) Expression correlation between LIGHT and selected targeting genes, including LTBR, TNFRSF11A and TNFRSF14. (D) The corresponding heatmap data in the detailed cancer types are displayed. (E) Based on the LIGHT-binding proteins, KEGG pathway analysis was performed. (F) (The molecular function data in GO analysis are also shown.

