Figure 2.
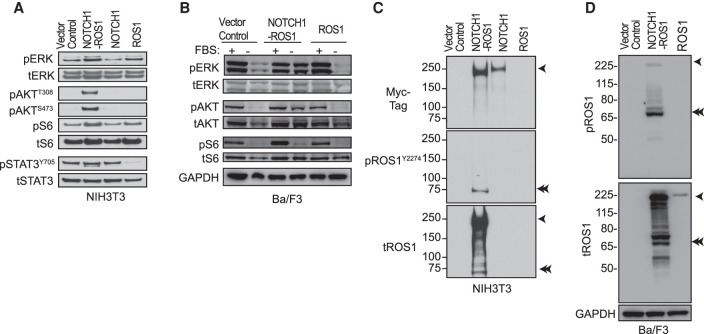
Activated ROS1 kinase in NOTCH1–ROS1 drives downstream signaling via MAPK, PI3K/Mtor, and JAK–STAT pathways. Western blot analysis of (A) stable NIH3T3 and (B) Ba/F3 cell lines showing phosphorylated (p-) and total (t-) protein levels of MAPK, PI3K/Mtor, and JAK–STAT pathways. Western blot analysis to show activation of ROS1 kinase in (C) stable NIH3T3 and (D) Ba/F3 cell lines showing phosphorylated (p-) and total (t-) protein levels. High exposure tROS1 blot is included in Supplemental Figure 1a to show ROS1 levels in ROS1 NIH3T3 cell model.

