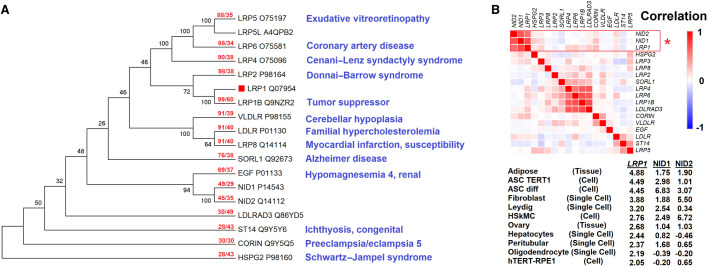
Figure 1.
The low-density lipoprotein (LDL) receptor family and development. (A) Sequences with an E-value <1 × 10⁻²⁰ based on BLAST of human LRP1 protein (red box). Sequences were aligned with the MUSCLE algorithm. The maximum likelihood tree shows the percent of 100 bootstrap analyses clustering at each node. The red text for each protein shows the length of coverage in BLAST hit followed by the percent identity relative to LRP1. Blue text is based on OMIM-annotated diseases for each gene. (B) Expression matrix for the genes of panel A using 200 data sets of tissues, cell lines, and single-cell annotations of the Human Protein Atlas. Correlations were calculated as 1 – Pearson's correlation. Below are the top samples for z-scores of LRP1, NID1, or NID2 expression levels.

