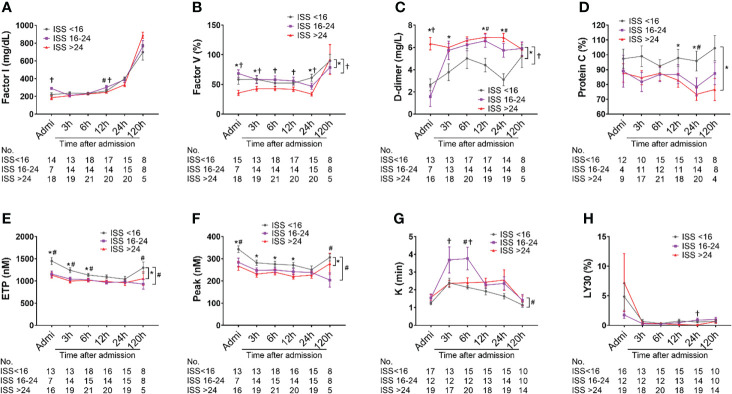
Figure 5.
Coagulation and fibrinolysis parameter abnormalities in poly-trauma patients. The blood samples were collected upon admission, and at 3h, 6h, 12h, 24h, and 120h after admission, and the coagulation and fibrinolysis parameters of factor I (A), factor V (B), D-dimer (C), sCD40L (D), ETP (E), peak (F), k-time (G), and LY30 (H) were measured by chromogenic assays, ELISA or TEG machines. The coagulation parameters in three different groups as ISS<16, ISS=16-24, and ISS>24 were calculated and the data were presented as mean ± SEM. The numbers of analyzed patients for the individual groups are displayed below the graph on each panel. Statistical analyses were performed by linear mixed-effect model for repeated measures and the least square means of each group comparison. * p<0.05, ISS>24 vs. ISS<16; † p<0.05, ISS>25 vs. ISS=16-24; # p<0.05, ISS=16-24 vs. ISS<16.

