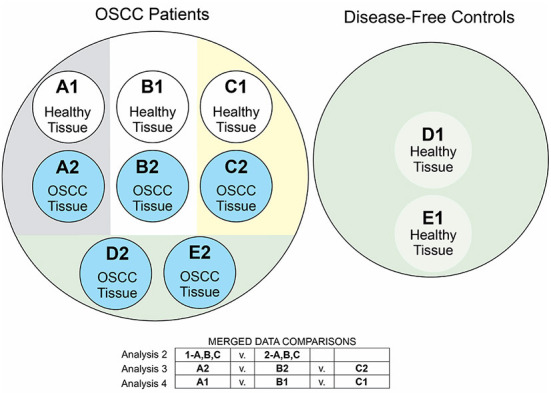
Figure 2.

Diagram of meta-analytic comparisons. We labeled each of the five studies in our meta-analysis with letters A–E, where A-C indicated the three studies with intra-subject control designs. We labeled each set of samples with the numbers 1-2, indicating the control/OSCC status of those samples. In our analysis 1, we examined the OSCC case vs. control samples within each study, comparing A1 vs. A2, B1 vs. B2, C1 vs. C2, D1 vs. D2, and E1 vs. E2. Analysis 2 compared the merged A2 + B2 + C2 case samples with the A1 + B1 + C1 control samples. Analysis 3 compared the case samples A2 vs. B2 vs. C2. Analysis 4 compared the control samples A1 vs. B1 vs. C1. The circle diagram summarizes these comparisons.
