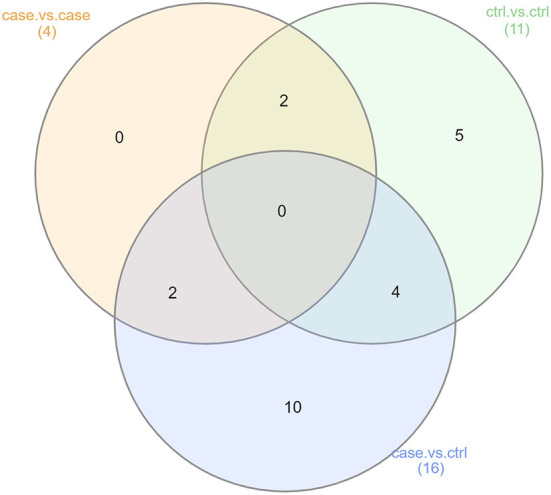
Figure 5.

Summary of functional LEfSe results (Analyses 2, 3, and 4). This Venn diagram describes the extent of confounding represented in our case vs. control functional analysis (Analysis 2). Of the 16 functional pathways found to be significantly more abundant in either the OSCC or control samples, 6 were also showed significant differences in abundance in either the case vs. case or control vs. control comparisons. This was another indication of non-OSCC related differences between the samples from studies A, B, and C.
