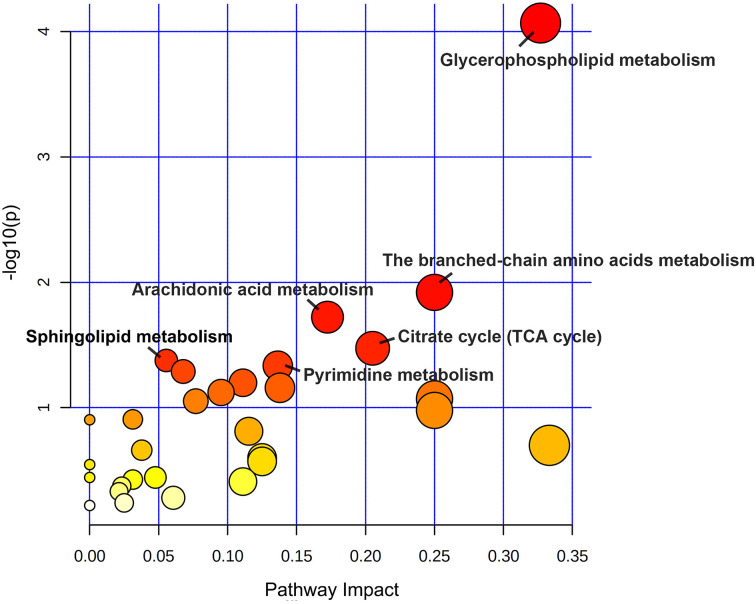
Figure 5.
The KEGG metabolic pathway impact analysis. The color and size of each node are based on the p values and pathway impact values, respectively. The “human Homo sapiens (KEGG)” library was selected to perform pathway enrichment analysis and topology analysis. The X-axis presents pathway impact values (based on Out-degree Centrality) and the Y-axis presents the respective p values (based on hypergeometric test). Each circle represents a pathway. The size of circle indicated the pathway impact score, whereas the color represents the p values. Larger circles represent higher impact factors, redder colors represent lower p values. Pathways with p values less than 0.05 were marked by name.

