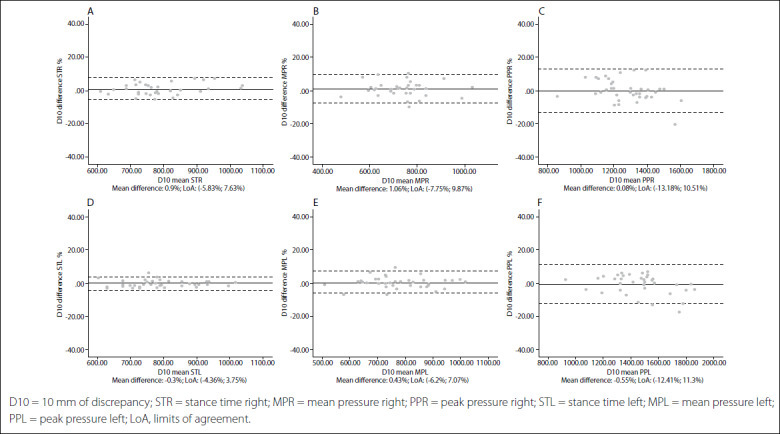
Figure 3. Bland-Altman plots for dynamic variables for each foot with 10 mm of leg length discrepancy (LLD). Differences between sessions plotted against the mean. Stance time right (A); Mean pressure right (B); Peak pressure right (C); Stance time left (D); Mean pressure left (E); Peak pressure left (F).

