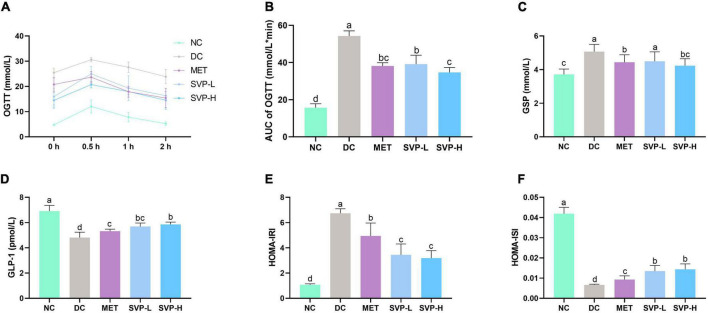
FIGURE 3.
Effects of oral SVP on the glucose tolerance and islet function-related indexes in T2DM mice. (A) Oral glucose tolerance test levels; (B) area under the curve values of oral glucose tolerance test; (C) glycated serum protein levels; (D) glucagon-like peptide-1 levels; (E) HOMA-insulin resistance index levels; (F) HOMA-insulin sensitivity index levels. Different superscript letters indicate statistically significant differences between the groups (p < 0.05).

