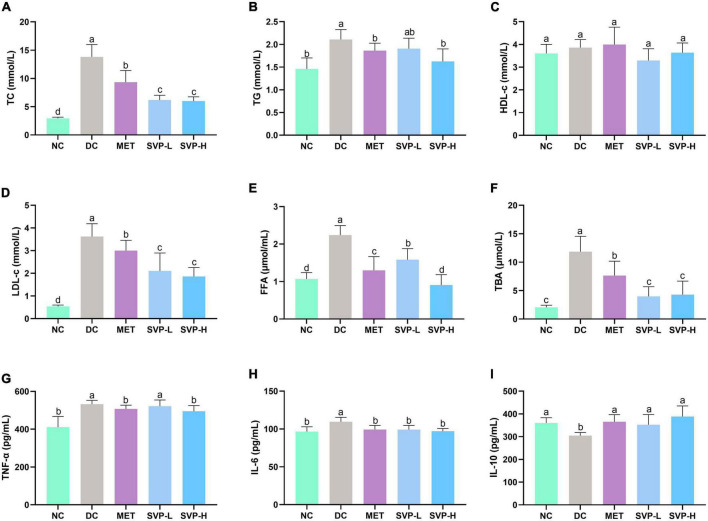
FIGURE 4.
Effects of oral SVP on the lipid metabolism and inflammation-related indexes in T2DM mice. (A) Total cholesterol levels; (B) total triglyceride levels; (C) high-density lipoprotein-cholesterol levels; (D) low-density lipoprotein-cholesterol levels; (E) free fatty acid levels; (F) total bile acid levels; (G) tumor necrosis factor-α; (H) interleukin-6 levels; (I) interleukin-10 levels. Different superscript letters indicate statistically significant differences between the groups (p < 0.05).

