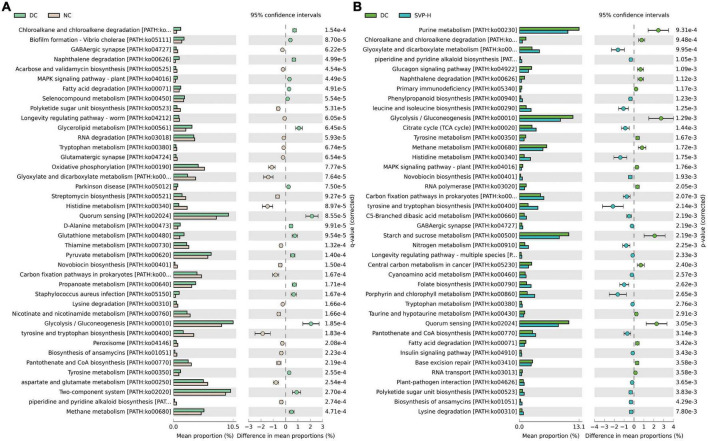
FIGURE 7.
The differences of predicted function of the intestinal microbiota based on PICRUSt2 with Welch’s t-test and the p-value corrected by Benjamini–Hochberg method. (A) DC group versus NC group; (B) DC group versus SVP-H group. Corrected p < 0.05, confidence intervals = 95%, top 40 functional modules are presented according to the order of corrected p-value.

