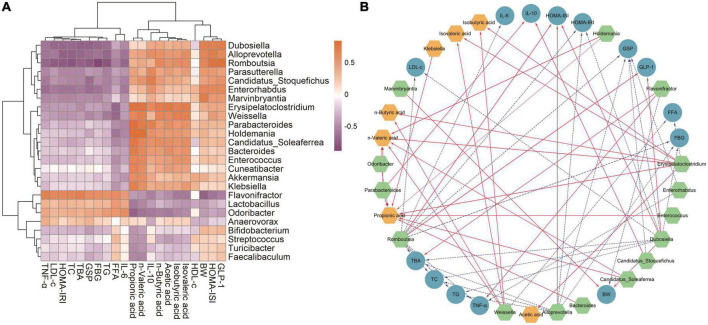
FIGURE 9.
Statistical Spearman’s correlations between the characteristic intestinal microbes and the biochemical indexes in T2DM mice. (A) Hierarchical clustering heatmap of the correlation between the characteristic intestinal microbes and the biochemical indexes. The chocolate and orchid nodes represent the positive and negative correlation coefficient, respectively; the color shades indicate the strength of correlation. (B) Visualization of the correlation network. Green, blue, and yellow nodes represent the characteristic intestinal microbes, biochemical indexes, and fecal SCFAs, respectively; the solid red lines and dotted blue lines indicate the correlation coefficient >0.6 (p < 0.01) and the correlation coefficient <–0.6 (p < 0.01), respectively. The linewidth reflects on the strength of correlation.

