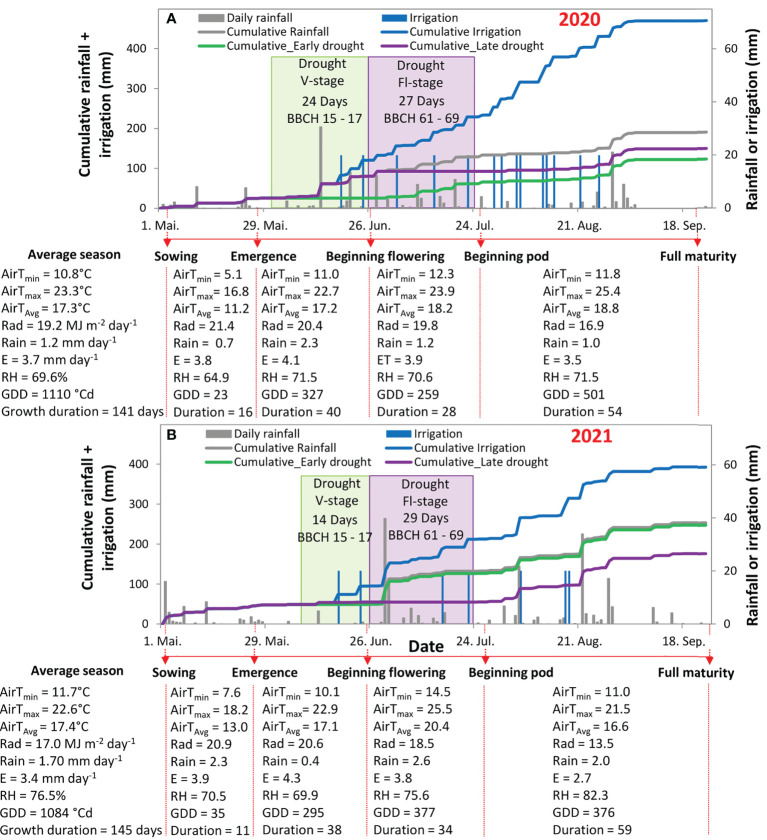
Figure 1.
Cumulative water input (rainfall + irrigation; left axis; A, B) and daily rainfall or irrigation (right axis; both panels) from the beginning of May till the end of September in the season 2020 (A) and 2021 (B). The green shaded area indicates the duration of using a shelter above the plants at the vegetative stage (V-stage) and the violet shaded area indicates the duration of using a shelter above the plants at the flowering stage (Fl-stage). The Meteorological elements and bioclimatic index for the soybean development stages, in both years, are in the tables below each figure specifying, in each phenological period, the minimum temperature (Tmin), the maximum temperature(Tmax), the average temperature (TAvg), the average solar radiation (Rad), the average rainfall (Rain), the daily evaporation (E), the percentage of relative humidity (RH), and the growing degree days (GGD).

