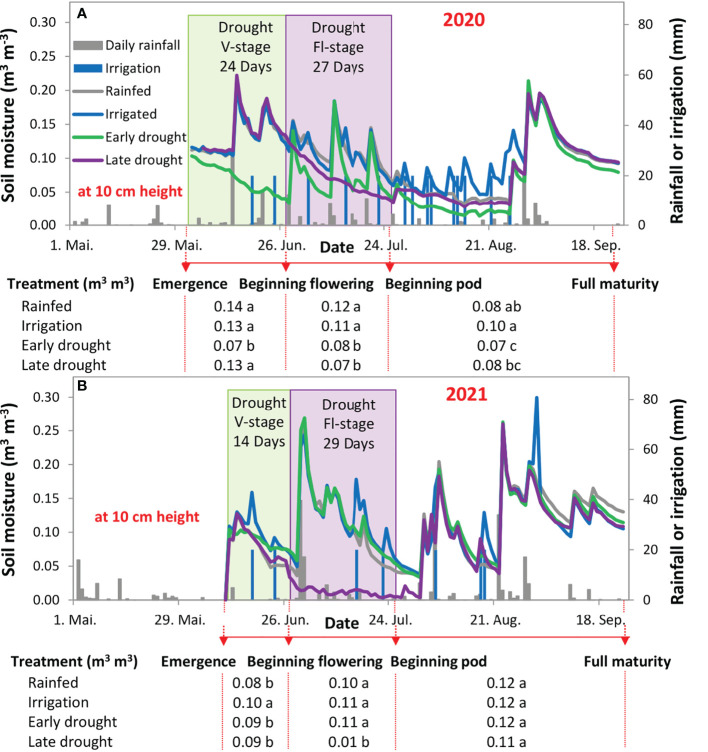
Figure 2.
Soil moisture at 10 cm height (left axis; A, B) and daily rainfall or irrigation (right axis; both panels) from the beginning of May till the end of September in 2020 (A) and 2021 (B). The green shaded area indicates the duration of using a shelter above the plants at the vegetative stage (V-stage) and the violet shaded area indicates the duration of using a shelter above the plants at the flowering stage (Fl-stage). The Meteorological elements and bioclimatic index for the soybean development stages, in both years, are in the tables below each figure.

