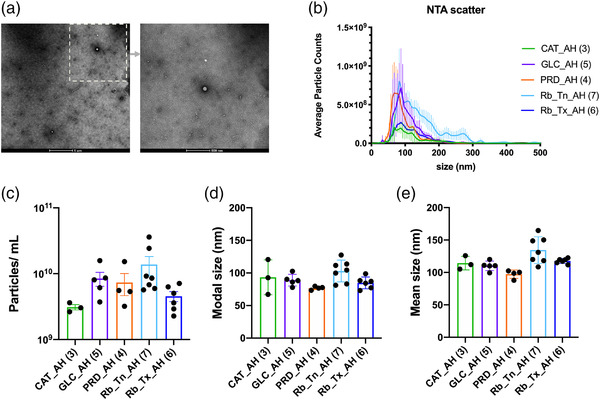
FIGURE 1.

Characterization of EV/EPs from unprocessed aqueous humor by Transmission Electron Microscopy (TEM) and NTA scatter analysis. (a) Representative TEM wide‐field and close‐up images of extracellular vesicles in a pediatric aqueous humor sample. (b) Average particle counts versus size distribution plots in each disease state. (c–e) Average particle concentration, modal, and mean size in each disease state. Error bars represent standard deviations obtained from each study group. See also Supplementary Figure 1 for particle counts versus size distribution plot for each sample
