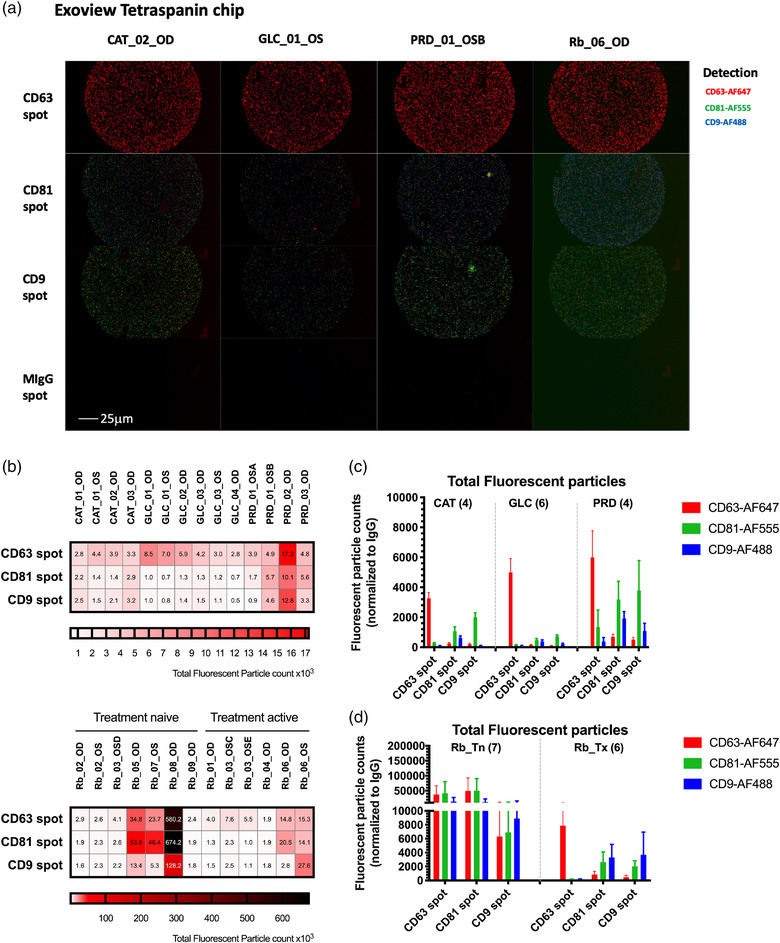
FIGURE 2.

Tetraspanin expression analysis of unprocessed aqueous humor samples using the SP‐IRIS analysis. Samples were analysed by the Exoview R100 system. (a) Representative fluorescent images detected by fluorescent‐conjugated antibodies (red: CD63‐AF647, green: CD81‐AF555 and blue: CD9‐ AF488) on Exoview tetraspanin chip immunocapture spots. (a) Total fluorescent particle counts normalized to isotype control IgG on a single capture spot in individual samples. (c,d) Total fluorescent particle counts normalized to isotype control IgG determined by detection antibody on three capture spots in five pediatric disease states. Error bars represent ± one S.E.M
