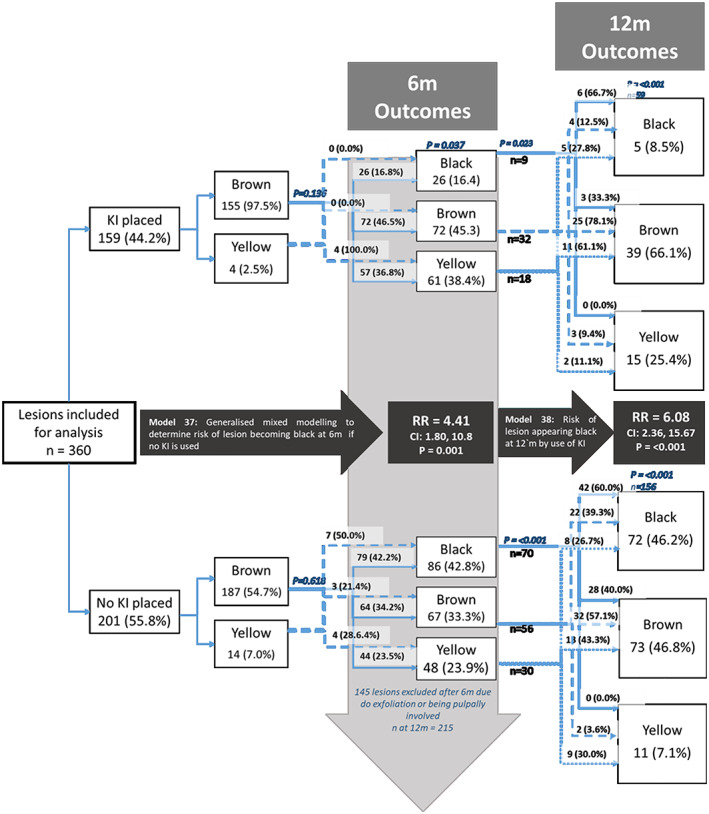
FIGURE 2.

Changes in color among ICDAS 5–6 lesions at baseline, 6‐month and 12‐month follow‐upa. a P‐values presented based on chi‐squared tests for differences in proportions among groups within the same column or differences in odds of black colour developing in the case of model 37 and model 38
