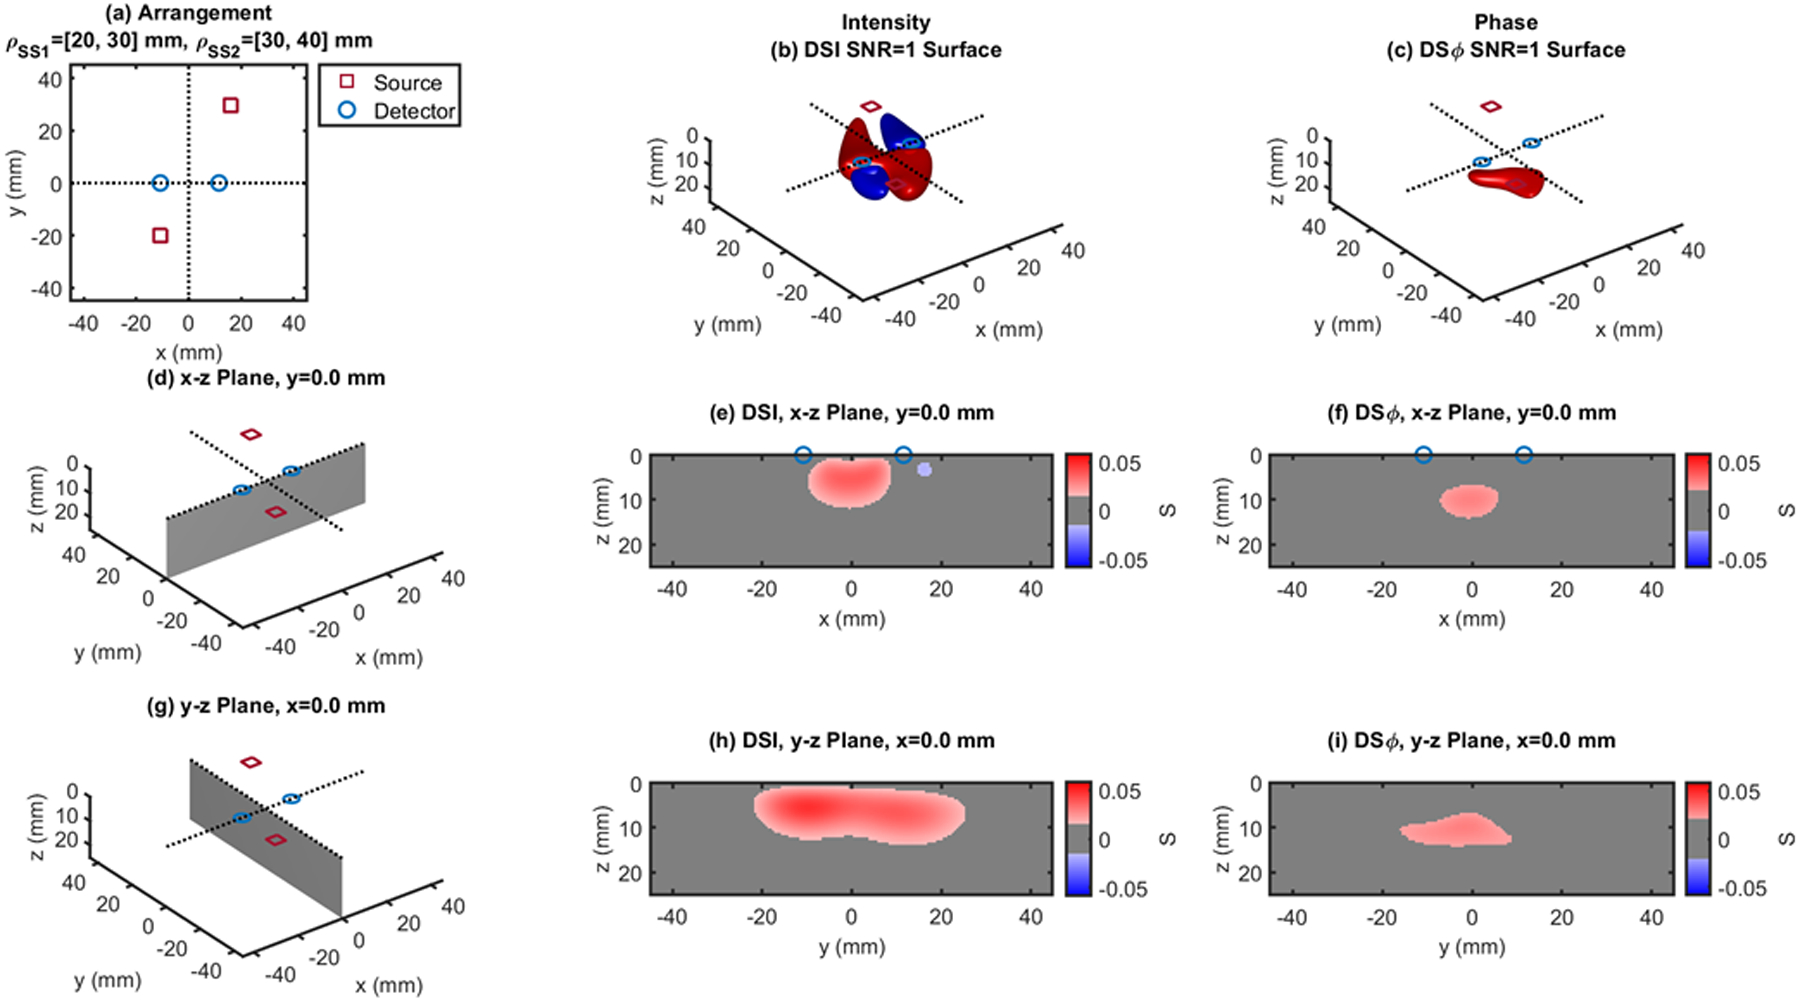
Fig. 8.

Dual-slope (DS) case based on two single slopes (SS1 and SS2) that feature source-detector distance of 20, 30 mm (ρSS1) and 30, 40 mm (ρSS2), respectively. (a) Source-detector arrangement in the x-y plane at z = 0 (Irregular: IRR). 3D rendition of the regions of sensitivity for (b) intensity and (c) phase. (d) Longitudinal x-z plane at y = 0 (shaded), and cross sections over this plane of the regions of sensitivity for (e) intensity and (f) phase. (g) Transverse y-z plane at x = 0 (shaded), and cross sections over this plane of the regions of sensitivity for (h) intensity and (i) phase. All regions of sensitivity are bounded by the surface or line at a signal-to-noise ratio (SNR) of 1. SDI: single-distance intensity; SDϕ: single-distance phase.
