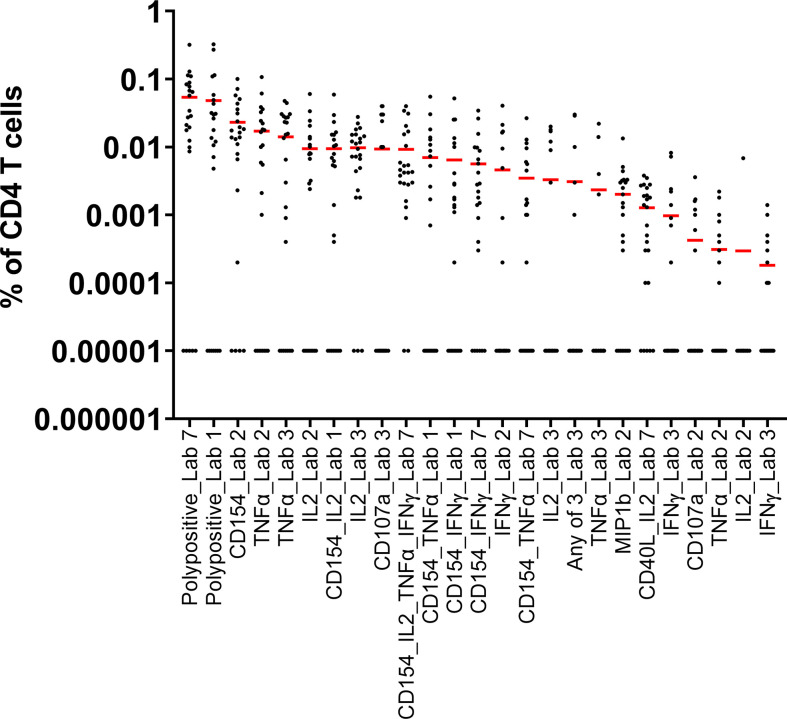
Figure 1.
Pilot Study 1: Evaluation of data from each of the participating laboratories. Each dot represents the A/California/07/2009 stimulated and background subtracted % of parent cells for a single sample. The red line indicates the mean of the 24 samples for each outcome for each laboratory. All 0 values were replaced by 0.00001 in order to represent the data. Seven laboratories participated in pilot study 1, however one laboratory did not provide data in time for inclusion in the assessment of the results. IFN, interferon; IL, interleukin; TNF, tumor necrosis factor.

