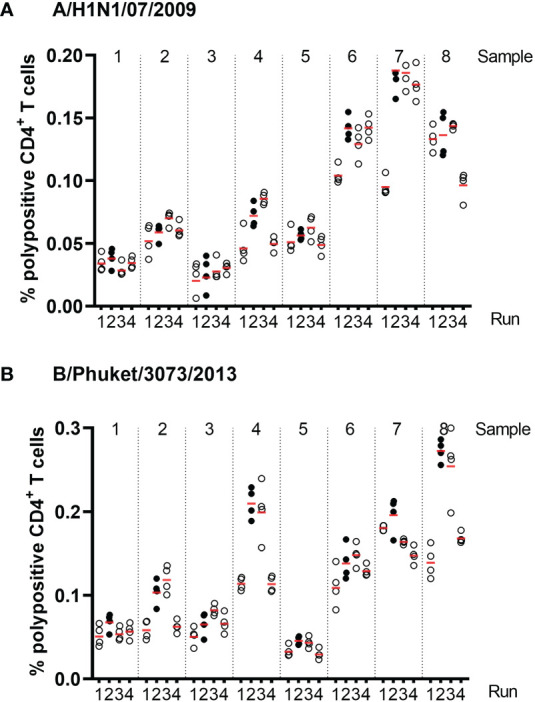
Figure 4.

Frequencies of corrected A/California/07/2009-specific (A) and B/Phuket/3073/2013-specific (B) polypositive CD4+ T cells in eight different samples, from four different test runs by two different operators in assays of intra- and inter-assay precision. Eight different samples were tested, 2 high, 2 medium and 4 low responders. Each dot represents an individual background-corrected response reported as a percent of polypositive CD4+ T cells. The horizontal lines demonstrate the mean response for each sample per run. Each color represents a different operator.
