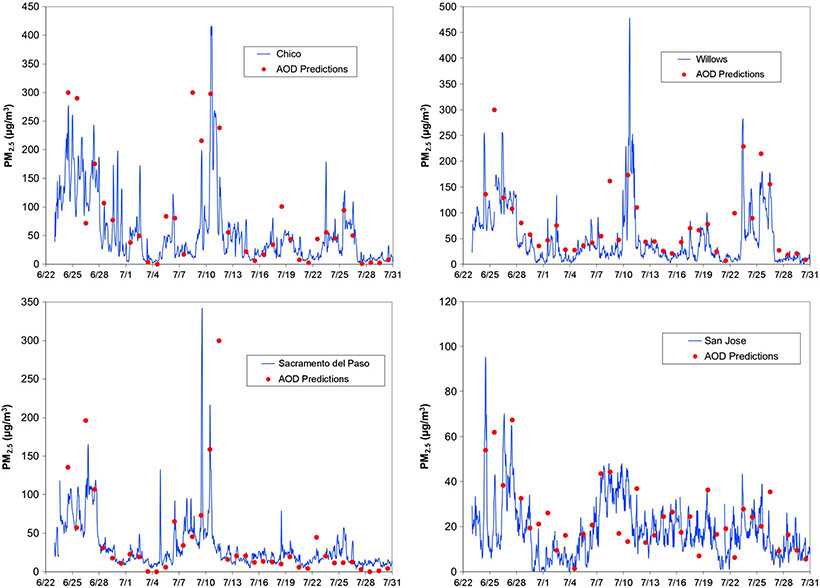
Figure 7.
Time series of surface PM2.5 concentrations (μg/m3)and predicted midday PM2.5 concentrations based on kernel-smoothed 5 × 5 pixel comparisons at Chico (top left), Willows (top right), Sacramento del Paso (bottom left), and San Jose (bottom right). Note that the scale of PM2.5 concentrations changes for each time series, especially San Jose.

