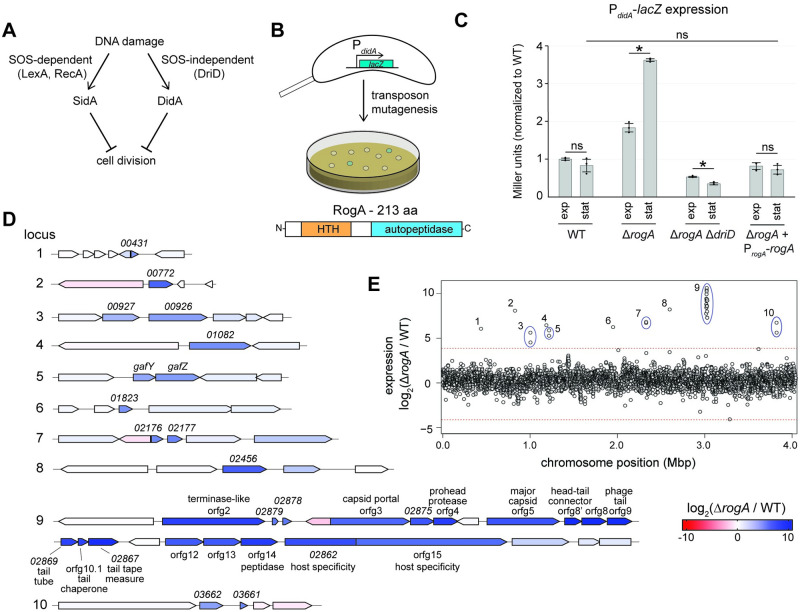
Fig 1. Identification of a GTA repressor.
(A) Schematic of the 2 DNA damage response pathways in Caulobacter crescentus. (B) Diagram of a transposon mutagenesis screen to identify mutants with altered expression of didA. Schematic of predicted RogA domains based on homology to known protein domains. (C) β-galactosidase assay measuring transcriptional activity of a PdidA-lacZ reporter with different genetic backgrounds (n = 3, error bars indicate SD). Cells were assayed in both exponential and stationary phase. * = p-value <0.05 between indicated data. ns = not significant. Data are available in S1 Data. (D) Transcriptomic analysis comparing wild-type to ΔrogA cells in stationary phase using RNA-seq. Genetic loci with a log2 fold-change greater than 4 are shown with each gene’s expression color-coded (see legend). (E) The log2 fold-change of each gene’s expression in the ΔrogA mutant relative to the wild type is plotted, with each gene’s genome position on the x-axis. Genetic loci with a log2 fold-change greater than 4 are shown with each gene’s expression color coded. Dotted line is equal to a log2 fold-change of 4. Mean log2 fold-change of all genes was 0.36 ± 1.01. Data are available in S1 Data. GTA, gene transfer agent.

