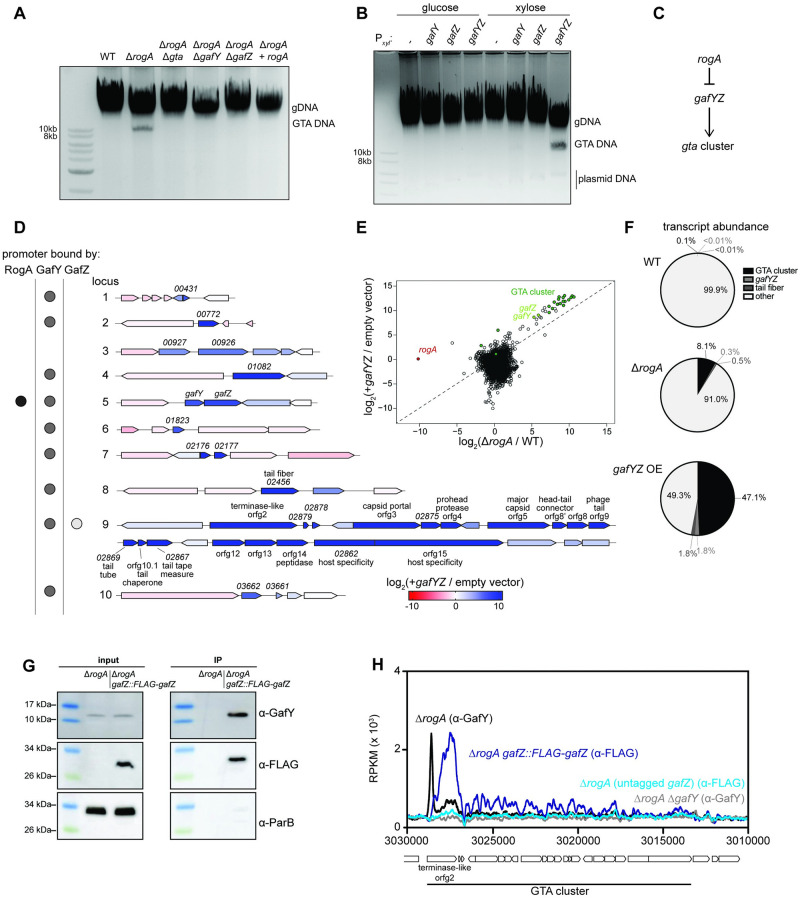
Fig 2. Characterization of the GTA regulatory pathway.
(A) Total DNA extraction from different strains grown up to stationary phase. DNA was purified and separated via gel electrophoresis on a 1% agarose gel. (B) Same as A with total DNA extracted from strains bearing a high-copy plasmid with the xylose promoter driving expression of either nothing (empty), gafY alone, gafZ alone, or both gafY and gafZ in their native arrangement. (C) Simple genetic diagram of how the gta gene cluster is hypothesized to be regulated. (D) Transcriptomic analysis comparing gafYZ overexpression to an empty vector control in stationary phase using RNA-seq. The 10 up-regulated loci from the ΔrogA RNA-seq are shown with their corresponding shading for the log2 fold change of each gene during gafYZ overexpression. Binding of RogA, GafY, and GafZ, as determined by ChIP-seq, are shown for each locus’ promoter by a black, gray, or white dot, respectively. (E) Log2 fold change of each gene during gafYZ overexpression compared to an empty vector is plotted as a function of the gene’s log2 fold change in a ΔrogA mutant compared to the wild-type strain. Genes in the GTA cluster are highlighted in dark green, gafY and gafZ in light green, and rogA in red. R2 of the GTA cluster genes and gafYZ (log2 transformed) is 0.92. Data are available in S1 Data. (F) Transcript abundance of 4 different categories out of all transcripts in different RNA-seq samples. Wedges are colored according to the legend. Data are available in S1 Data. (G) Western blot analysis of co-immunoprecipitation of GafY with immunoprecipitation of Flag-GafZ. ParB served as a non-associated protein control. (H) ChIP-seq profiles of GafY with an anti-GafY antibody in either ΔrogA (black) or ΔrogA ΔgafY (gray) and FLAG-GafZ with an anti-FLAG antibody in either ΔrogA gafZ::FLAG-gafZ (dark blue) or ΔrogA (light blue). Profiles were plotted with the x-axis representing genomic positions and the y-axis representing the number of reads per kilobase pair per million mapped reads (RPKM) using custom R scripts. Data are available in S1 Data. GTA, gene transfer agent.

