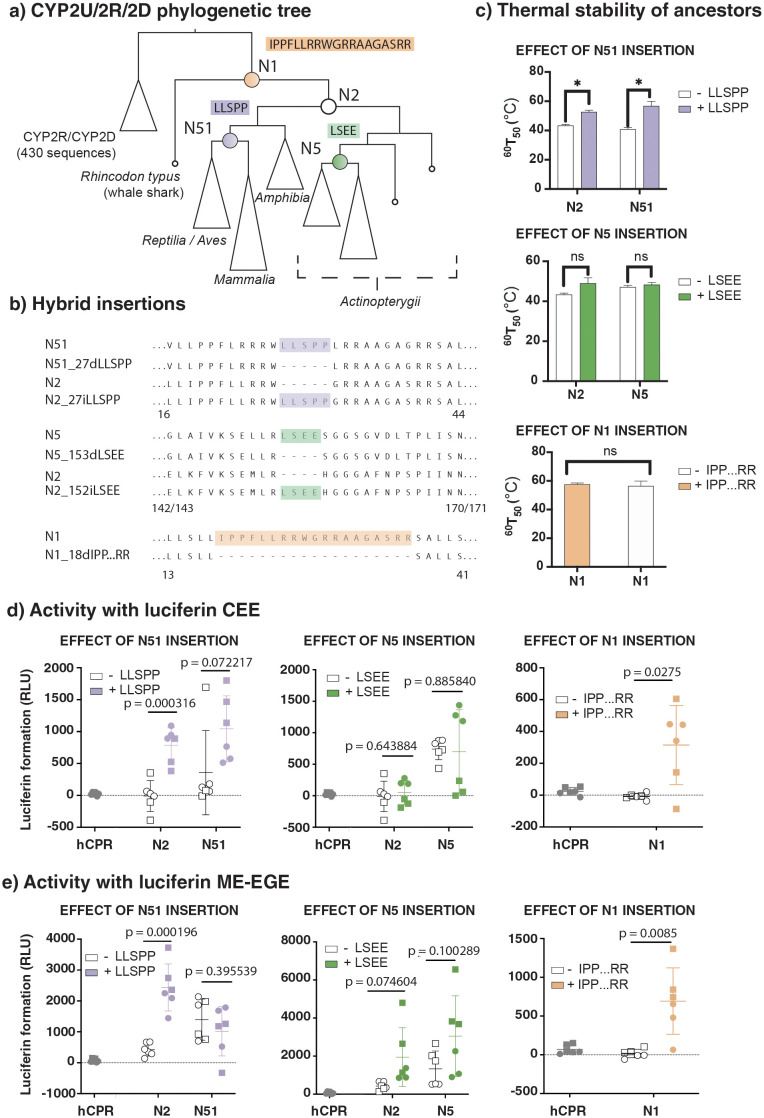
Fig 3. A, Phylogenetic tree showing positions of CYP2U/CYP2R/CYP2D ancestors chosen for synthesis and evaluation.
Coloured boxes indicate the content that was removed from correspondingly coloured ancestral nodes (N51, N5, and N1) and, in the case of the N51 and N5 insertions, preemptively inserted into N2. B, Amino acid sequences surrounding and including the insertion or deletion of the content at each ancestor. Numbers under sequences indicate the position numbers of the start and end columns represented in the alignment. C, Thermal stability assays for each ancestor with and without inserted content. Data are means +/- SEM, N = 2, ns indicates a not significant result. D, E, Activity assays for the substrates luciferin CEE and luciferin ME-EGE for each ancestor with and without inserted content. Membranes from cells expressing only human CPR are included as a negative control. Different symbols indicate different experimental repeats, performed in triplicate, lines indicate mean and standard deviation, and p-values were determined by a two-tailed Student’s t-test. No data points were excluded.

