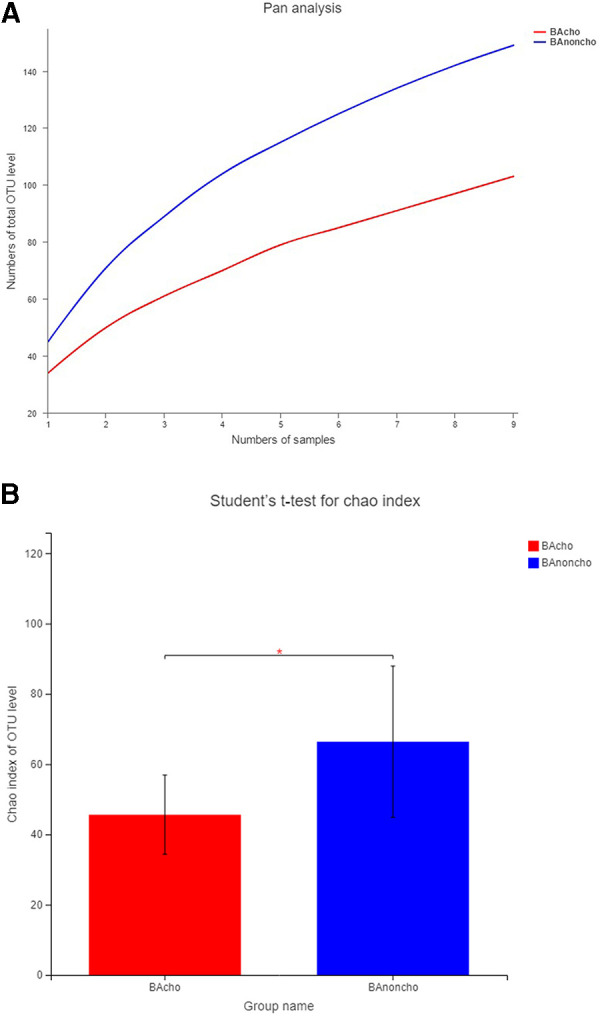
Figure 1.

The OUT level in BAcho and BAnoncho. (A) The numbers of total OTU level were increasing with the numbers of samples. The numbers of OTU level in BAnoncho were more than those in BAcho in same numbers of samples. (B) In BAnoncho group, Chao index of OTU level was significantly increased compared to the BAcho group. (*p < 0.05, OTU: Operational Taxonomic Unit, defined by >97% 16S rRNA sequence similarity. Chao index:using for calculating the Community richness).
