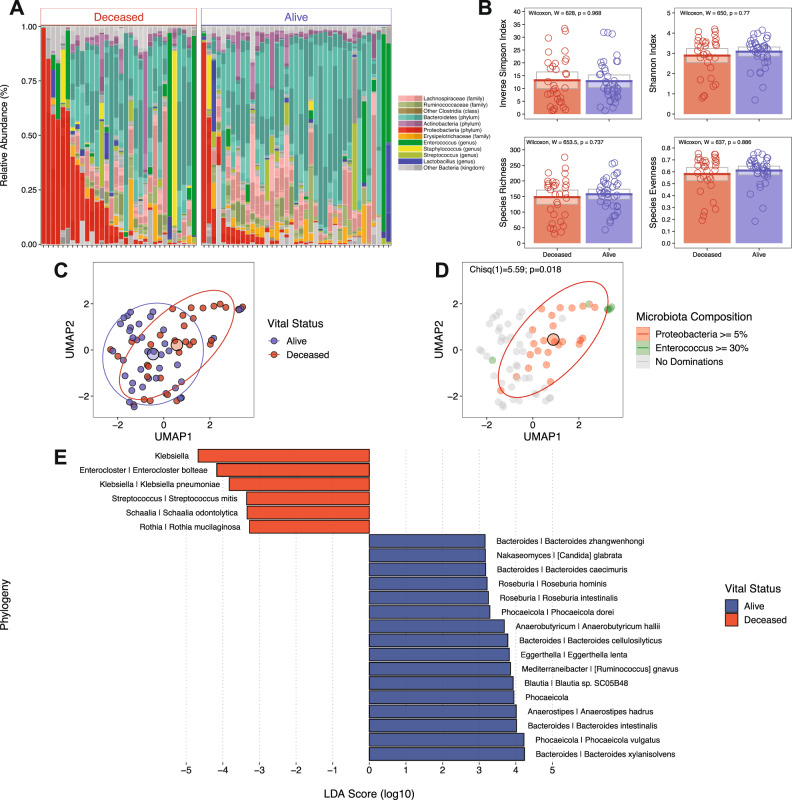
Fig. 1. Fecal microbiome composition in patients with severe COVID-19 stratified by mortality.
A Shotgun metagenomics-based taxonomy plots stratified by survival where taxa are shaded to biologically relevant levels (legend to the right). B Alpha diversity (Inverse Simpson and Shannon Index) plots and Species Richness and Evenness stratified by survival where colored bars represent the average value for survival (blue bars: alive, red bars: deceased) while gray boxes denote 95% confidence intervals. Wilcoxon rank-sum, two-tailed tests were implemented and p-values were adjusted via the Benjamini-Hochberg method. C Uniform Manifold Approximation and Projection (UMAP) from shotgun metagenomics-based taxonomy, colored by survival (blue points: alive and red points: deceased) with centroids and 95% CI ellipses. D UMAP colored by expansion of Enterococcus (green), Proteobacteria (red), both Enterococcus and Proteobacteria (red and green halves), and no expansions (gray) with centroids and 95% CI ellipse. A two-tailed, chi-squared test was used to compare expansions to vital outcomes. E A Linear discriminant analysis effect size (LEfSe) showing the significant (Wilcoxon rank-sum, two-tailed, p ≤ 0.05) effect sizes of taxa between survival groups (blue bars: alive, red bars: deceased). A linear discriminant analysis was performed in lieu of adjusting for multiple comparisons. n = 71 independent samples from patients.

