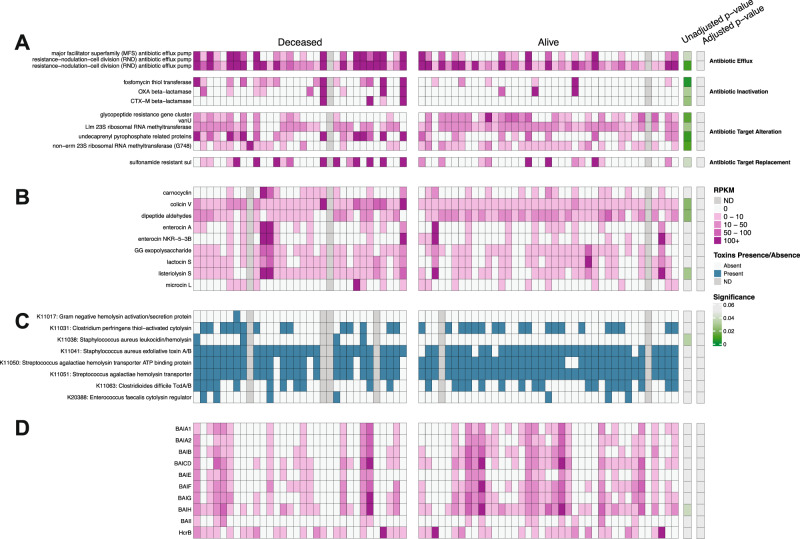
Fig. 2. Representation of genes encoding antibiotic resistance, toxins and metabolite production stratified by Mortality.
Panel A displays genes encoding for antibiotic resistance. Panel B displays genes encoding for bacteriocins. Panel C displays genes encoding for toxins/hemolysins/cytolysins. Panel D displays the genes responsible for bile acid conversion, as well as butyrate-related enzymes and desaminotyrosine. Genes in Panels A, B, D were quantified using RPKM values (shades of pink) while toxin genes in Panel C were determined as presence/absence (blue/white). Gray boxes show missing data. P-values and adjusted p-values (via Benjamini-Hochberg method) were obtained from Wilcoxon rank-sum, two-tailed tests (A, B, D) and a two-tailed, chi-squared test (C) and are shown as shading from non-significant (gray) to statistically significant (green). n = 71 independent samples from patients.

