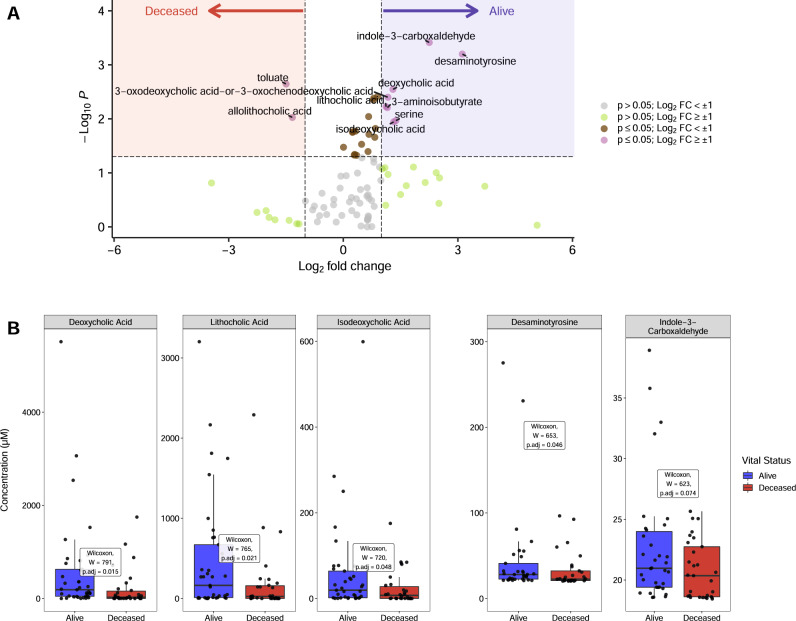
Fig. 3. Qualitative and quantitative fecal metabolomic analyses.
A Volcano plot of normalized metabolite concentrations, where values above the horizontal line (Wilcoxon rank-sum, two-tailed, unadjusted p-value > 0.05) and log2 fold-change values >= 1 were used to identify metabolites associated with survival. Red shading shows compounds more abundant in the deceased population while blue shading displays compounds that were more abundant in the alive population. Gray points denote p-values > 0.05 and log2 fold-change values < ±1; green points denote p-values > 0.05 and log2 fold-change values >± 1; brown points denote p-values < 0.05 and log2 fold-change values < ±1; and purple points denote p-values < 0.05 and log2 fold-change values > ±1. B Metabolites identified in panel A for survival groups (blue: alive and red: deceased) were subsequently quantified in fecal extracts by LC-MS and are shown as boxplots and compared using Wilcoxon rank-sum, two-tailed tests with p-values adjusted for multiple comparisons via the Benjamini-Hochberg method (n = 68 independent samples from patients). Bile acids, desaminotyrosine and indole-3-carboxaldehyde are in units of µM. Boxes show interquartile ranges (IQR) where the center black line represents the median and the whiskers (vertical black lines) extend to 1.5 × IQR or to the minimum and maximum value, whichever is closest to the median.

