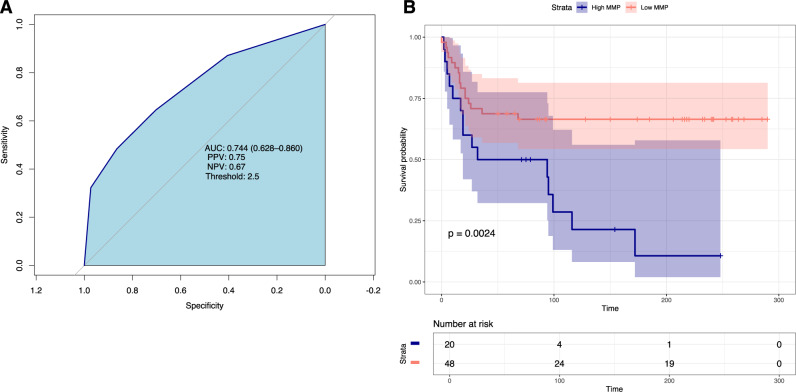
Fig. 4. A Microbiome Metabolite Profile (MMP) predicts mortality in patients with severe COVID-19.
A Area under the curve (AUC) for the microbiome metabolite profile and mortality. AUC = 0.744. Positive predictive value (PPV) = 0.75 and negative predictive value (NPV = 0.67). B Kaplan–Meier survival curves stratified by low MMP scores (0–1, red shading) versus high MMP score (2–4, blue shading) are plotted. Time in days is presented on the X-axis. Log-rank test was used to assess significant differences. n = 68 independent samples from patients.

