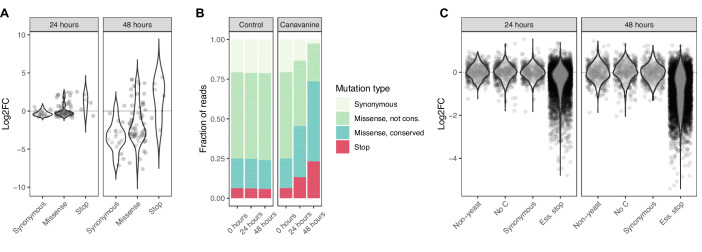
Figure 2. Base editor screens identify loss-of-function mutations in positive and negative selection schemes.
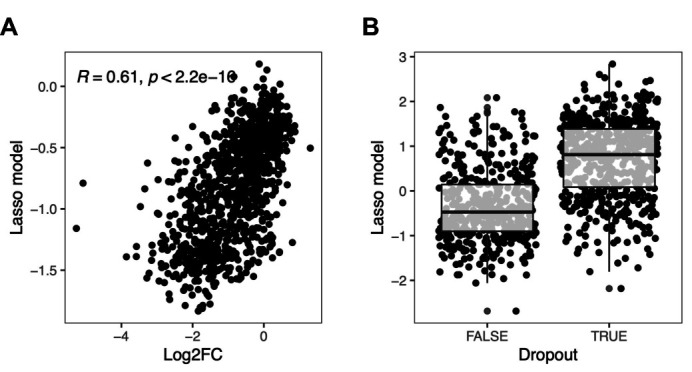
(A) For the canavanine screen, canavanine was added to cultures of cells that were base edited with a library of 90 gRNAs targeting the CAN1 gene. The log2 fold change of reads per gRNA at 24 and 48 hr after canavanine treatment compared to before treatment is shown. gRNAs are grouped by the type of mutation they are predicted to introduce. (B) The fraction of reads that map to gRNAs introducing different types of mutations into CAN1 48 hr after starting the canavanine treatment is shown. gRNAs expected to introduce missense mutations are split according to the conservation of the expected amino acid mutation, where ‘conserved’ is defined by PROVEAN scores <–5 and ‘not conserved’ by PROVEAN scores ≥–5. (C) For the fitness screen, yeast cultures were base edited using a library of gRNAs predicted to introduce premature stop codons into essential genes. These mutations are therefore expected to lead to a drop out of affected cells (and the responsible gRNA) from the cultures. The log2 fold change of reads per gRNA 24 and 48 hr compared to 0 hr after induction of base editing is shown. The gRNAs belong to either of four classes: (i) not targeting the yeast genome, (ii) no cytosine residue in the base editing window, (iii) predicted to introduce synonymous mutations only, (iv) predicted to introduce stop codons into essential genes.
Figure 2—figure supplement 1. Effect of sequence context on base editing efficiency.


