. 2022 Oct 19;11:e83042. doi: 10.7554/eLife.83042

Figure 1. Cryo-electron tomography visualizes chikungunya virus (CHIKV) spherules at the plasma membrane.

(A) Computational slice through a cryo-electron tomogram of a CHIKV viral replicon particle (VRP)-transduced baby hamster kidney (BHK) cell. The two framed insets are offset in the tomogram volume by 7 nm. Scale bar, 100 nm. (B) 3D segmentation of the tomogram shown in (A). Yellow: plasma membrane, red: viral RNA, and blue: protein complex sitting at the spherule necks. (C) Subtomogram containing one spherule. The arrow indicates the densities present at the membrane neck. Scale bar, 25 nm. (D) Schematic of an initial model of the organization of a spherule. Black: plasma membrane, red: viral RNA, and blue: protein complex sitting at the spherule necks.

Figure 1.

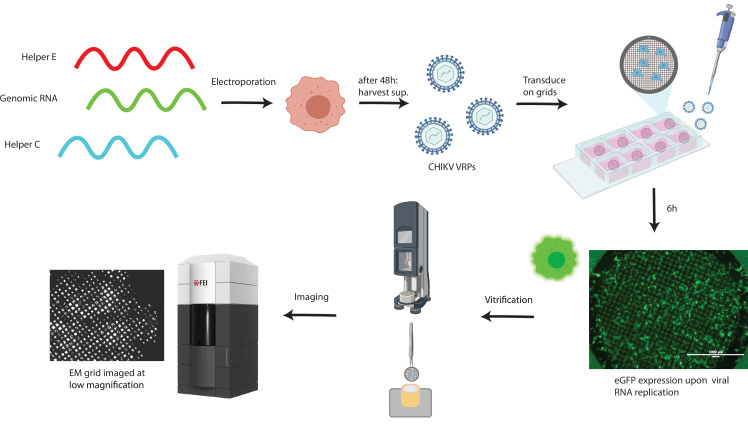
Figure 1—figure supplement 1. Workflow for cryo-electron tomography of chikungunya virus (CHIKV) viral replicon particle (VRP)-transduced cells.

Figure 1—figure supplement 1.

Production of CHIKV VRPs using three different RNAs (Gläsker et al., 2013). Green: genomic, carries the sequence of the non-structural proteins, and an eGFP sequence under regulation of the sub-genomic (SG) promoter. Red: ‘helper E,’ carries the sequence of E1,E2,E3,6K/TF under regulation of the SG promoter. Blue: ‘helper C,’ carries the sequence of the capsid protein under regulation of the SG promoter. See the Materials and methods section for the detailed procedure. Cells electroporated with these three RNAs produce VRPs that contain the only RNA having a packaging signal, i.e., the ‘genomic RNA’ which is devoid of structural genes. Baby hamster kidney (BHK) cells seeded on EM grids are transduced with CHIKV VRPs, 6 hr after transduction >~90% of cells on grids display green fluorescence (scale bar, 1 mm). After vitrification by plunge-freezing into liquid ethane-propane, cells are imaged at the Titan Krios cryo-transmission electron mictoscope.
Figure 1—video 1. Cryo-electron tomogram of a cluster of chikungunya virus (CHIKV) spherules at the plasma membrane.
Download video file (10.1MB, mp4)
The video displays consecutive xy slices through the cryo-electron tomogram also shown in Figure 1.
Figure 1—video 2. Uncropped cryo-electron tomogram of a cluster of chikungunya virus (CHIKV) spherules at the plasma membrane.
Download video file (16.3MB, mp4)
The video displays consecutive xy slices through the uncropped cryo-electron tomogram also partially shown in Figure 1 and Figure 1—video 1. The uncropped tomogram allows an overview of how the spherule cluster relates to the cell periphery. Some intracellular features are seen such as a bundle of microtubules on the right and putative cytoplasmic ribosomes in the lower part.
Figure 1—video 3. Tracing of dsRNA filaments in spherules.
Download video file (8MB, mp4)
The video displays consecutive xy slices through part of the cryo-electron tomogram shown in Figure 1 and Figure 1—videos 1; 2. Overlayed on the tomogram slices is the outcome of the filament tracing for one spherule, with filaments represented in red.