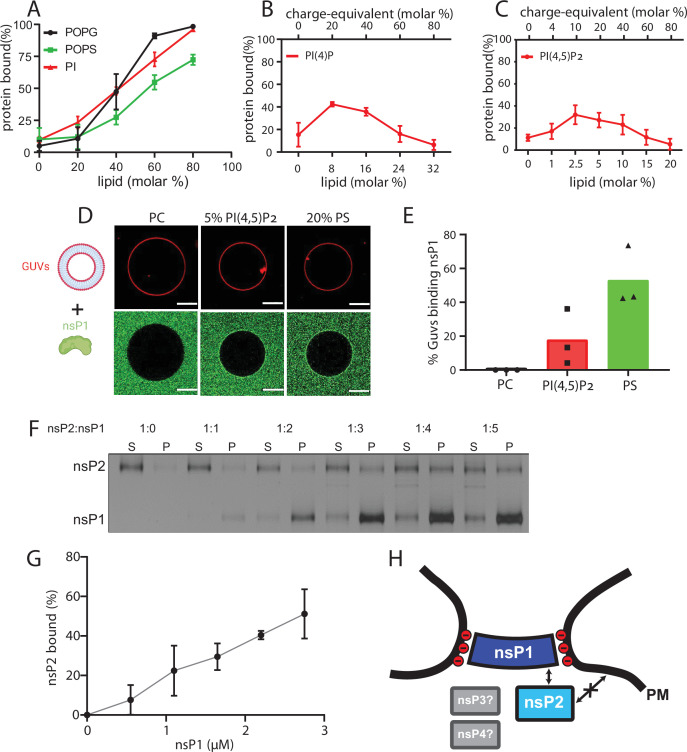
Figure 3. NsP1 binds to membranes containing monovalent anionic lipids and recruits nsP2 in a concentration-dependent manner.
(A–C) Copelletation of nsP1 with multilamellar vesicles (MLVs) with varying percentages of the anionic phospholipids 1-palmitoyl-2-oleoyl-sn-glycero-3-phospho-l-serine (POPS), 1-palmitoyl-2-oleoyl-sn-glycero-3-phospho-(1′-rac-glycerol) (POPG), phosphatidylinositol (PI) (A), PI(4)P (B), and PI(4,5)P2 (C) in a background of 1-palmitoyl-2-oleoyl-sn-glycero-3-phosphocholine (POPC) and 20% cholesterol. Representative example gels shown in Figure 3—figure supplement 2. The percentage of protein associated with membranes was quantitated from gels and plotted. Each plot represents the mean ± SD of three independent replicates. (D) Confocal imaging of nsP1- ATTO488 (green) binding to giant unilamellar vesicles (GUVs) (red) with POPC, or POPC including 5 mol% PI(4,5)P2, or 20% POPS. Scale bar, 20 µm. (E) Quantification of nsP1-bound GUVs from three experiment series. Data represent the percentage of nsP1-binding GUVs calculated from total number of GUVs observed for each experiment series plotted against the respective GUVs types. (F) Co-pelletation assay of nsP2 and nsP1 with POPS-containing MLVs. NsP2 and MLV concentrations were kept constant, while the nsP1 concentration was varied. Analysis of supernatant (S) and pellet (P) fractions by SDS-PAGE. (G) Quantification of pelleted nsP2 with nsP1. The experiment shown in (F) was repeated two times. The pellet intensity at each nsP1 concentration was normalized to the total nsP2 intensity and plotted (mean ± SD) against the nsP1 concentration. (H) Schematic of the findings from A to G, in the context of the neck complex. The non-structural proteins nsP3 and nsP4 were not included in these experiments but are displayed for completion as possible components of the neck complex.


