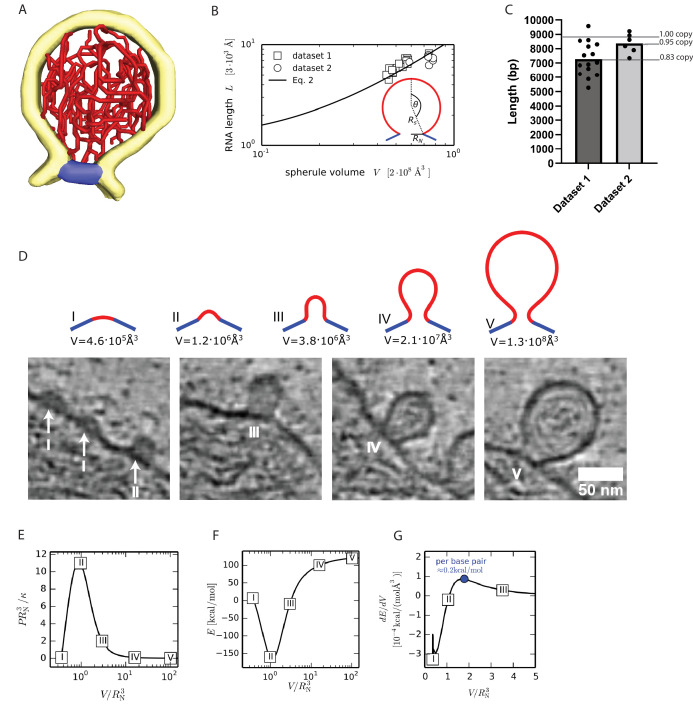
Figure 4. A single copy of the genomic RNA determines the shape of the spherule membrane.
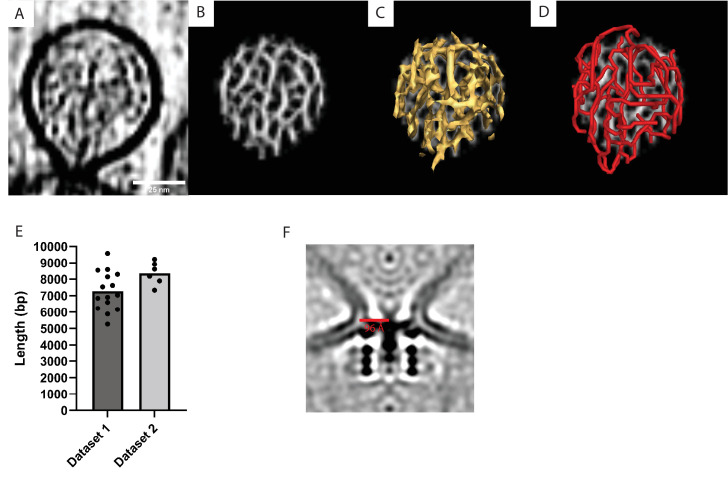
(A) Segmentation of the dsRNA traced within a spherule. Yellow: membrane, red: RNA, and blue: neck complex base. (B) The RNA length L increases with spherule volume V. A common fit of both datasets with Equation 2 gives and , while was determined experimentally. The inset shows the spherical cap model schematically. (C) Estimation of the dsRNA length (in base pairs) and the average copy number per spherule. One point represents a single spherule, and the datasets represents tomograms acquired on different cells. (D) The top row shows five shapes that minimize the energy (Equation 1) for a given spherule volume. Below, the predicted shapes are compared to different sizes of nascent and full-size spherules observed in cryo-electron tomograms of Semliki forest virus (SFV) viral replicon particle (VRP)-transduced cells. Scale bar, 50 nm. (E) Pressure-volume relation for a unitless membrane tension of a = 10–2. The corresponding membrane shapes are shown in subfigure D. (F) Energy (Equation 1) as a function of the spherule volume for = 10–2, κ=10 kBT and . (G) The energy change per change in volume is shown, which leads to a maximal energy to be supplied per base pair of 0.2 kcal/mol, where we assumed the volume of a single base pair to be not larger than .


