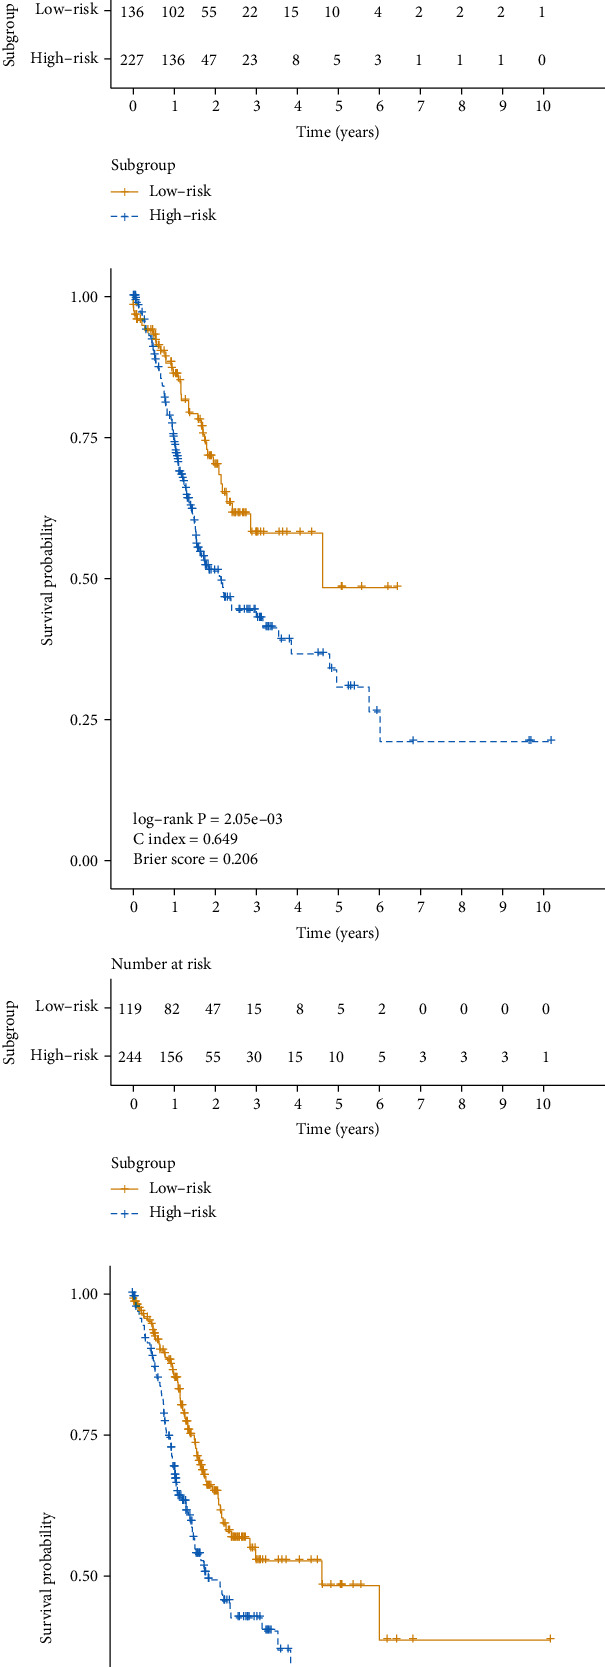
Figure 3.

Kaplan–Meier curves for OS time between two different subgroups of TCGA cohort obtained from different approaches: (a) autoencoder; (b) PCA; (c) SNF.

Kaplan–Meier curves for OS time between two different subgroups of TCGA cohort obtained from different approaches: (a) autoencoder; (b) PCA; (c) SNF.