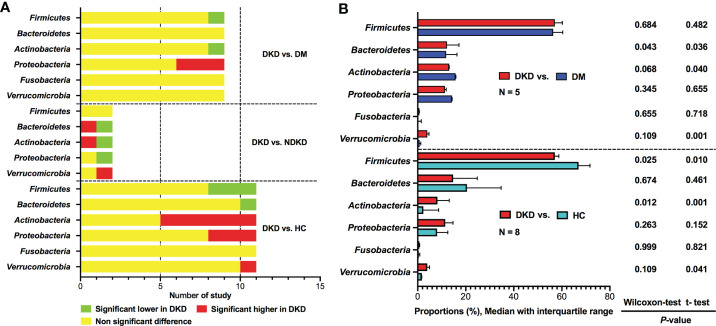
Figure 2.
Qualitative and quantitative analysis of gut microbiota at the phylum level. (A) Qualitative comparisons at the phylum level; (B) Comparisons of average abundances at the study level for bacterial phylum. DKD, diabetic kidney disease; NDKD, non-diabetic kidney disease; DM, diabetes mellitus; HC, healthy controls; N, number of study.

