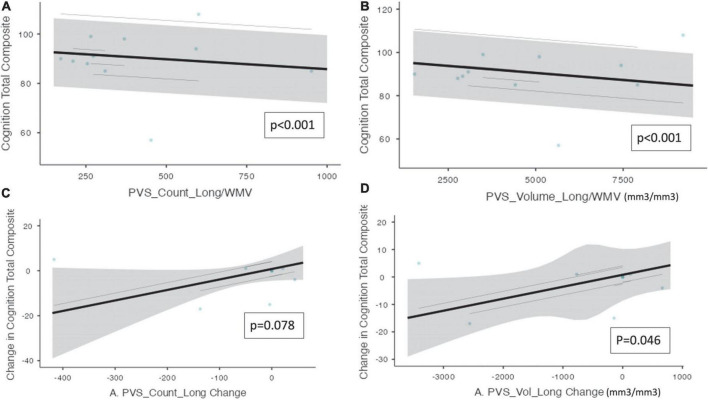
FIGURE 2.
Perivascular spaces measurements and NIH cognition total composite score. Demonstrates a significant relationship between PVS measurements and cognition as measured by the NIH cognition total composite score (n = 10). The PVS cluster number and PVS volume were both adjusted by white matter volume. (A) PVS cluster number and cognition total composite score. (B) PVS volume and cognition total composite score. (C) The change in PVS cluster numbers and the change in cognition total composite scores longitudinally. (D) The change in PVS volume and the change in cognition total composite scores longitudinally. Individual participants are depicted as blue dots. The gray band represents the 95% confidence interval, and the black line represents the estimated mean.

