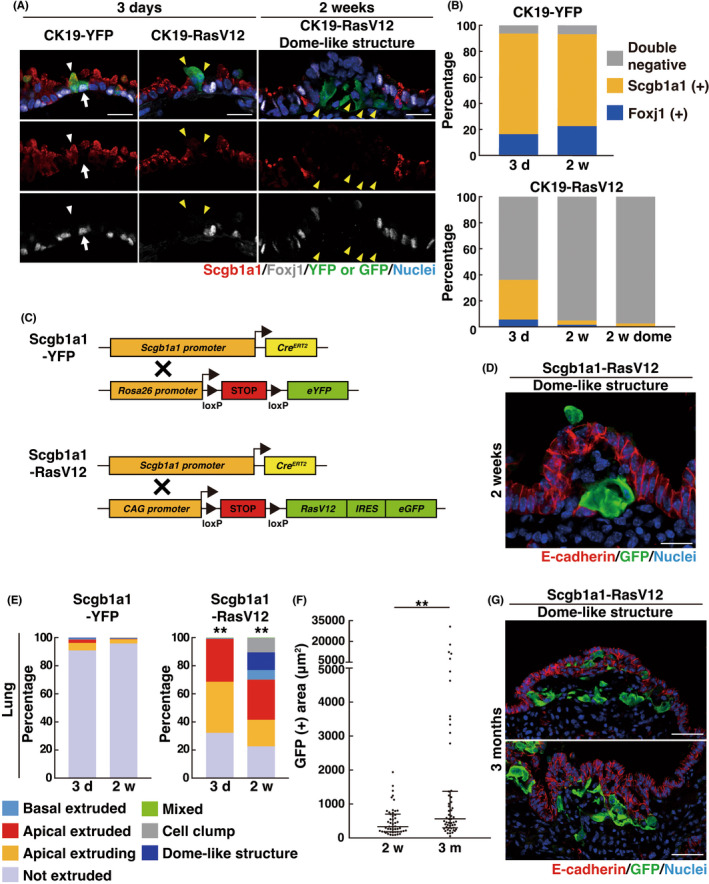
FIGURE 3.

Formation of dome‐like structures in Scgb1a1‐RasV12 mice. (A) Immunofluorescence images of bronchial epithelia from CK19‐YFP or CK19‐RasV12 mice with tamoxifen treatment. Scale bars, 20 μm. (A, B) A loss of the differentiation markers in RasV12‐expressing cells. (A) White arrows or arrowheads indicate YFP‐expressing Foxj1+ ciliated cells or Scgb1a1+ club cells, respectively, whereas yellow arrowheads indicate RasV12‐expressing cells lacking Foxj1 and Scgb1a1 expression. (B) Quantification of Foxj1+, Scgb1a1+ or Foxj1− Scgb1a1− double‐negative cells. n = 269 (3 days) and 248 (2 weeks) cells for CK19‐YFP and 285 (3 days), 305 (2 weeks), and 302 (2 weeks dome) cells for CK19‐RasV12. Data are from three mice. (C) Strategy for the establishment of mice expressing YFP or RasV12‐GFP under the control of a club cell‐specific Scgb1a1 promoter. (D, G) Immunofluorescence images of dome‐like structures in bronchial epithelia from Scgb1a1‐RasV12 mice at 2 weeks (D) or 3 months (G) after tamoxifen injection. Scale bars, 20 μm (D) or 50 μm (G). (E) Quantification of the phenotypes of YFP or RasV12 cells. n = 373 (3 days) and 408 (2 weeks) clusters for Scgb1a1‐YFP and 410 (3 days) and 407 (2 weeks) clusters for Scgb1a1‐RasV12. Data are from four mice. **p < 0.01, chi‐squared test. (F) Quantification of GFP‐positive area in dome‐like structures from Scgb1a1‐RasV12 mice. Data are median ± quartiles. n = 51 (2 weeks) and 54 (3 month) dome‐like structures from four (2 weeks) or three (3 months) mice. **p < 0.01, Mann–Whitney test. Note that the longer‐term fate of dome‐like structures can be analyzed in Scgb1a1‐RasV12 mice, but not in CK19‐RasV12 mice, as CK19‐RasV12 mice die within 2 months of tamoxifen injection.
