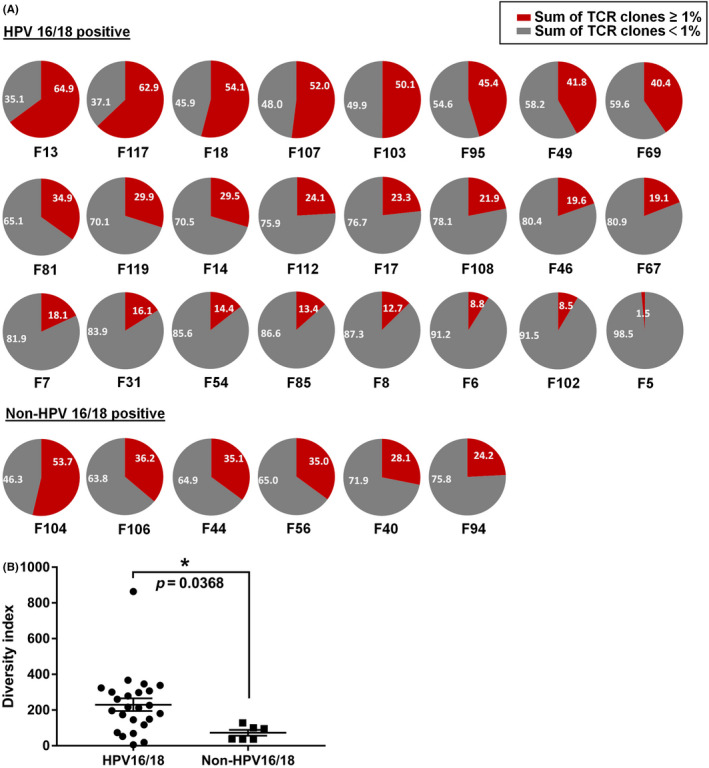
FIGURE 1.

Diversity of T cell clonotypes in the tumor microenvironment of cervical cancers infected with different HPV types. Tumor issues were collected from 30 patients with cervical cancers, and RNA of which were proceeded to TCR repertoire analysis using next‐generation sequencing. (A) Pie charts depict the frequency distribution of unique TCR clone. The gray portion of each pie chart represents the sum of clones with frequencies <1%, and the red portion of each pie chart represents the sum of clones with frequencies >1%. (B) The diversity index calculated for TCRβ in HPV16‐ or HPV18‐positive cervical cancers (n = 24) and other HPV type‐infected cervical cancers (n = 6). Asterisk indicates significant difference between the two groups
